Transcription of RUCKUS Analytics Data Sheet - CommScope
1 data Sheet 2022 CommScope , Inc. All rights Provides comprehensive visibility into network operations Accelerates network and client troubleshooting Identifies, prioritizes and recommends remediation steps for service issues Helps IT teams improve the user experience Works with your RUCKUS network to automatically validate service levelsIT teams often lack the tools to ensure required network service levels in an environment of ever-increasing user connectivity demands and network complexity. Helpdesk tickets from user connectivity issues pile up while IT struggles to glean insight from network data . When service issues affect user experience, IT often lacks a way to identify root causes and define a course of action to fix the problem. RUCKUS Analytics from CommScope is a cloud service for network Analytics and assurance.
2 Powered by machine learning (ML) and artificial intelligence (AI), it helps you get the most from your RUCKUS network. The service gives IT comprehensive visibility into network operations. It accelerates troubleshooting and helps IT teams meet their network service level agreements (SLAs). The service identifies network assurance incidents, classifies them by severity, traces root causes and makes specific recommendations for remediation. It automatically monitors network health relative to configurable thresholds. Advanced client troubleshooting and incident Analytics give IT teams the power to address service issues for individual users and devices. RUCKUS Analytics works with your RUCKUS network to allow it to self-validate without the need for overlay sensors. You can identify and address many service issues before they even affect service also delivers robust reporting and informative dashboards.
3 Create custom dashboards and data visualizations with the data Explorer tool and flexibly explore your network data warehouse with drag-and-drop ease. RUCKUS Analytics aggregates raw data and automatically transforms it into deep insight into network operations. This ML- and AI-powered Analytics service frees you from a wide variety of manual tasks associated with network assurance. RUCKUS ANALYTICSN etwork Analytics and assurance for RUCKUS enterprise networksThis detail from the main dashboard shows a circle packing chart. It provides a graphical representation of the network hierarchy, with color coding that indicates where network incidents have occurred. You can easily zoom in for a closer view by clicking on an area of the chart. 2 RUCKUS Analytics Network Analytics and assurance for RUCKUS enterprise networksComprehensive network intelligence helps you deliver on network SLAs in support of users, devices and applications.
4 RUCKUS Analytics automatically measures the impact of SmartZone configuration changes on network performance. You can observe the effects of each change on a portion of the network before rolling it out more broadly. This helps to avoid fully rolling out changes that might have an adverse effect on network performance. It scales to support the largest deployments expanding capacity transparently to meet your requirements. RUCKUS Analytics supports two control and management architectures: SmartZone* for on-premises and private cloud/ data center deployments, and RUCKUS Cloud for cloud-managed deployments. RUCKUS Analytics has an industry-unique combination of attributes: Automated data baselining and insights driven by ML and AI Health and SLA monitoring Powerful, holistic troubleshooting Automatic classification of incident severity Service validation without the need for an on-site data collector or overlay sensors Granular access to raw data with deep exploration and custom dashboards 12 months of storage with flexible data reportingStreaming telemetry with a modern data stack for advanced analyticsRUCKUS Analytics is designed for the unique data profile generated by network devices.
5 On-premises controllers securely connect to the cloud and stream lightweight health KPIs and telemetry. The high-performance data stack ingests and processes the data to serve as the basis for queries, reports and baseline metrics. Network health monitoring The service automatically monitors network health, with an overview tab that provides a high-level summary view. Select other health monitoring tabs to view metrics in specific health categories: connection, performance and infrastructure. Network health monitoring gives you instant visibility into metrics like AP service uptime, time to connect, connection success rate, client throughput and more. You define the service levels you want to measure against. For example, you might want to set the time to connect goal at five seconds RUCKUS Analytics will tell you what percentage of the time the network meets that goal.
6 The service lets you readily demonstrate to others in your organization performance to SLAs. Incident Analytics powered by machine learning and artificial intelligence RUCKUS Analytics enables machine-assisted proactive networking for your RUCKUS deployment. It automatically establishes a normal range of behavior for each network element, without requiring any input from IT. Then it uses machine learning to automatically identify service incidents related to connectivity, performance and infrastructure that affect user experience. It uses artificial intelligence to classify RUCKUS Analy ticsSmartZone cl usterSecure bi-directionaltelemetry and control Customer pr emisesFast analytic querie sEnsemble MLData vis ib ilityCompute clu ster* SmartZone or higher is RUCKUS Analytics Network Analytics and assurance for RUCKUS enterprise networksAutomatic service validation RUCKUS Analytics works with your RUCKUS network to automatically validate service levels without the need for overlay sensors.
7 Access points act as virtual clients to identify possible service disruptions, often before they affect users. The system can perform a variety of tests, including: WLAN, LAN and WAN connectivity EAP, RADIUS, DHCP and DNS Ping, traceroute and speed test (upload/download)Melissa your own AI-powered virtual network assistant RUCKUS Analytics includes a powerful AI-powered virtual network assistant called Melissa. Combining an intuitive interface with advanced natural language processing, Melissa determines the administrator s intent in posing a wide variety of inquiries and delivers highly insightful responses. IT teams save valuable time with ready access to information that helps them manage network operations without the need for any service management integration RUCKUS Analytics integrates closely with leading IT service management (ITSM) products from ServiceNow and Salesforce to initiate helpdesk tickets automatically and let IT get a head start in resolving them.
8 This ensures that, when a service issue occurs, it is flagged for the helpdesk to address. Without such a system in place many issues that affect user experience go reports and dashboards A wide variety of standardized reports provides visibility into network performance, traffic patterns, application usage and more. Summary views provide high-level information, and you can drill down to the level of individual network components and devices. Examples of standardized reports include: Network traffic and client trends, top devices, top SSIDs, traffic distribution and more Client reports by OS and device manufacturer, top clients by usage, client trends, session details and moreservice incidents by severity so you can address the highest-priority issues first. The system provides details for each incident, including: Root cause and recommended action Affected areas (client operating system types, access point models, firmware versions, WLANs and more) Other impact details, including severity, client impact and duration List of impacted clients Presentation of the underlying data that drives the incidentRUCKUS Analytics dramatically reduces mean time to resolution for service incidents.
9 It can eliminate some helpdesk tickets by letting you address issues before they affect users. By addressing the root cause for one incident, you can avoid other incidents that might arise from that cause. Service providers can realize instant business value when level 1/2 helpdesk personnel can remediate complex network problems using RUCKUS Analytics . Powerful client troubleshooting With simple and flexible search and a holistic client troubleshooting page, RUCKUS Analytics gives you a complete picture of client experience for easy connectivity and user experience diagnostics, including: Successful, slow and failed connections Disconnect events Roaming events and failed roams Connection quality (RSSI, MCS, client throughput) Network incidents affecting users, with links to see incident detailsClient troubleshooting is a powerful tool that helps you understand and address issues affecting specific clients on the network.
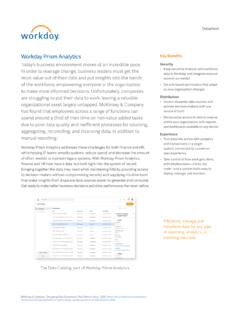
10 4 RUCKUS Analytics Network Analytics and assurance for RUCKUS enterprise networks Inventory AP, switch and controller count, models, firmware, status and more Application top apps and their usage trends, top app groups and usage, top ports and more Device-specific reports complete visibility and usage reports for clients, APs and switchesThe service lets you download reports as raw data , a PDF file or a CSV file. Forward the results to stakeholders inside or outside the organization. data Explorer custom dashboards, data visualizations and more The RUCKUS Analytics data Explorer tool lets you create custom dashboards to dissect and analyze data from your network ecosystem. Drag-and-drop dashboard creation makes it easy to design views tailored to your needs. You can easily position and reposition dashboard tiles, edit tiles at will and toggle between different views.