ANNUAL ADMISSIONS STATISTICAL REPORT
• The proportion from socio-economically disadvantaged areas rose from 8.2% to 15.9%. • The proportion from areas of low progression to higher education rose from 11.4% to 15.6%. • The proportion declaring a disability rose from 7.2% to 10.4%. • The proportion of women rose from 48.6% to 54.2%. FOOTNOTE 1.
Download ANNUAL ADMISSIONS STATISTICAL REPORT

Information
Domain:
Source:
Link to this page:
Documents from same domain

ox.ac.uk/study
www.ox.ac.ukUndergraduate Prospectus 2 019 ENTRY | OXF O33 UNIVERSITY OF OXFORD Oxford is .. . Undergraduate Prospectus 2019...what you make it ox.ac.uk/study www.youtube.com/Oxford
OXFORD UNIVERSITY CALENDAR - University of …
www.ox.ac.uk1 OXFORD UNIVERSITY CALENDAR: NOTES ON STYLE 13.3.12 This document may be downloaded from www.ox.ac.uk/gazette/calendar/ CONTENTS Degrees and …
UNIVERSITY OF OXFORD STYLE GUIDE
www.ox.ac.ukThe style guide is not intended for public or external use, and does not purport to compete with OUP’s professional writing guides and dictionaries. Objectives of the style guide

Strategies to Promote Emotional Resilience
www.ox.ac.ukUAS Conference Series 2013/14 4 February 2014 Strategies to Promote Emotional Resilience Dr Ruth Collins and Alan Percy Counselling Service
SAMPLE LETTER: INVITATION TO FAMILY MEMBER OR …
www.ox.ac.ukSAMPLE LETTER: INVITATION TO FAMILY MEMBER OR FRIEND FOR YOUR GRADUATION CEREMONY [Your own address and contact details in the UK] [Date] The Entry Clearance Officer
International Trends in Higher Education 2016–17
www.ox.ac.uk6 T he International Trends in Higher Education 2015 report highlighted the growing popularity of a range of internationalisation strategies – beyond the traditional emphasis on international student recruitment – and showcased examples
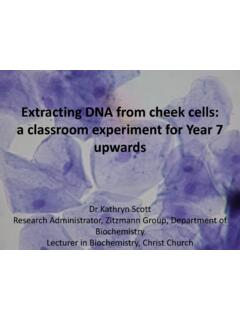
Extracting DNA from cheek cells: a classroom experiment ...
www.ox.ac.ukExtracting DNA from cheek cells: a classroom experiment for Year 7 upwards Dr Kathryn Scott Research Administrator, Zitzmann Group, Department of

Visual identity guidelines
www.ox.ac.uk2 Unique visual identity 3 Effective communications 4 Using these guidelines 5 The Oxford logo 20 Oxford blue 21 Complementary colours 22 Typography 23 Stationery templates 24 Digital communication templates 25 Writing style guidelines 26 Photography 27 Design matters 28 Ceremonial belted crest 29 Online brand toolkit 30 Further information ...
Preliminary report from the Joint PHE Porton Down ...
www.ox.ac.ukPreliminary report from the joint PHE Porton Down & University of Oxford SARS-CoV-2 LFD test development and validation cell 8 November 2020 SARS-CoV-2 viral proteins and is not reliant on the host’s immune response. In contrast to RT-PCR, LFDs detect viral protein rather than RNA.
UNIVERSITY OF OXFORD STYLE GUIDE
www.ox.ac.ukAlthough this style guide is freely available online it has not been written with public or external use in mind. The University of Oxford Style Guide does not purport to compete with OUP’s professional writing guides and dictionaries. Objectives of the style guide We have three main objectives in writing this style guide:
Related documents
Supporting the attainment of disadvantaged pupils - GOV.UK
assets.publishing.service.gov.ukthe impact of the pupil premium in focusing attention on raising disadvantaged pupils’ attainment. It is clear, however, that there is more to do. For example, in 2014, only 36.5 per cent of disadvantaged pupils achieved 5 A*-C including English and maths GCSEs, compared with 64.0 per cent of other pupils.
Key stage 4 performance, 2019 (revised) - GOV.UK
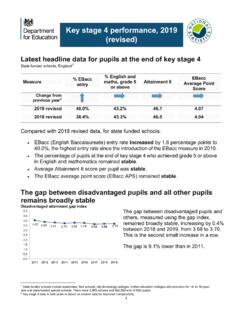
assets.publishing.service.gov.ukThe percentage of pupils at the end of key stage 4 who achieved grade 5 or above ... The gap between disadvantaged pupils and others, measured using the gap index, remained broadly stable, increasing by 0.4% between 2018 and 2019, from 3.68 to 3.70. This is the second small increase in a row.

Education Policy in the UK - ERIC - Education Resources ...
files.eric.ed.govA third problem policy area has been the reall number oflatively sm pupils staying on in education past the age of 16 and thus the low proportion achieving level 2 or 3 qualifications, ... introduction of an education maintenance allowance paid to disadvantaged young people age 16-19 to encourage them to stay on in full time education. The ...
CONSTRUCTIVIST APPROACH TO TEACHER EDUCATION: AN ...
files.eric.ed.govand scientific attitude of standard six pupils with different achievement levels. The study revealed that methods have differential effects on different contexts, that is, different pre-achievement levels. These differences were due to differences in the process variables. The study suggests that to implement any method, the context needs to be

Schools’ responses to Covid-19: The challenges facing ...
www.nfer.ac.ukgroup or one-to-one sessions to support pupils with the greatest need, in the main using interventions recommended by other teachers. • In July, approximately two in five senior leaders had firm intentions to access the Government’s £350 million National Tutoring Programme (NTP) for disadvantaged pupils. The main barrier for those .
The Economic Impacts of Learning Losses - OECD
www.oecd.orgon the affected pupils. This analysis suggests plausible ranges for the economic impact of existing and on-going learning ... the order of 3% lower career earnings if schools immediately returned to 2019 performance levels. Disadvantaged students will almost certainly see larger impacts. And, with the forecast of further disruptions in normal ...

Diversity and inclusion in schools report - Pearson
www.pearson.comDisadvantaged pupils (e.g. eligible for free school meals, Looked After Children) SEND or additional needs Black, Asian and minority ethnicities Top seven groups that could be more thoughtfully included in the resources, topics and materials that are taught in schools 49% White teaching staff – 63% agree BAME teaching staff – 52% agree