
Binary Solid-Liquid Phase Diagram Introduction
3. The temperature is measured with an electronic digital thermometer. Try to avoid melting the insulation on the lead to the probe (any further) 4. Discontinue cooling on all runs after the first definite break has occurred. 5. Maintain a well-packed ice-water bath around the cooling tube. 6.
Download Binary Solid-Liquid Phase Diagram Introduction

Information
Domain:
Source:
Link to this page:
Documents from same domain

Why is Gentrification a Problem - Williams College
web.williams.edu2. External costs of gentrification In order to better understand the potential social cost of community instability, consider Figure 1 below.
Community Based Targeting Mechanisms for Social …
web.williams.eduCOMMUNITY BASED TARGETING FOR SOCIAL SAFETY NETS 4 appear to be the major tradeoffs in the public policy choice of community-based targeting. First,
GALOIS THEORY: LECTURE 18 - web.williams.edu
web.williams.eduGALOIS THEORY: LECTURE 18 LEO GOLDMAKHER 1. PROOF OF THE FUNDAMENTAL THEOREM OF GALOIS THEORY Last time we demonstrated the power of the FTGT by using it to give a short proof of the Fundamental
GALOIS THEORY: LECTURE 24 - web.williams.edu
web.williams.eduGALOIS THEORY: LECTURE 24 LEO GOLDMAKHER 1. CONSTRUCTING FINITE FIELDS Although most of the semester we stated and proved theorems about general field extensions L=K, in practice

INTRODUCTION TO REAL ANALYSIS - Williams College
web.williams.eduINTRODUCTION TO REAL ANALYSIS WilliamF. Trench ... Section 4.2 provides a brief introduction to the way in which continuityand differentiabilitycan be studiedby means of sequences. Sections 4.3–4.5 treat infinite series of constant, sequences and infiniteseries of functions,

Experiment 7 (i) Gravimetric Determination of Chlorine in ...
web.williams.eduExperiment 7 (i) Gravimetric Determination of Chlorine in the Cobalt Complex Discussion ... we dissolve a known quantity of a soluble mixture containing chloride ... In a given solvent the speed of an ion depends primarily on its size (effective radius) and charge.

MEGA-SPORTING EVENTS IN DEVELOPING NATIONS: …
web.williams.eduMEGA-SPORTING EVENTS IN DEVELOPING NATIONS: PLAYING THE WAY TO PROSPERITY? Victor A. Matheson and Robert A. Baade Department of …
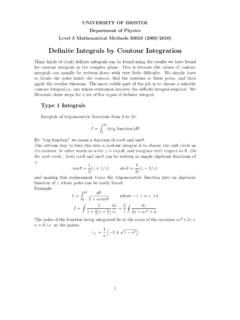
Definite Integrals by Contour Integration
web.williams.eduNov 26, 2006 · C Z- Z+ Of the poles, only z+ lies inside the unit circle, so I =2πiR+ where R+ is the residue at z+ To find the residue we note that this is a simple pole and if we write the integrand as f(z)=g(z)/h(z) the residue at z+ is: g(z+) h (z 2 2i(az+ +1) 1 i √ 1− a2 Hence the integral required is 2π/ √ 1− a2 Type 2 Integrals Integrals such as I = +∞ −∞ f(x)dx or, …
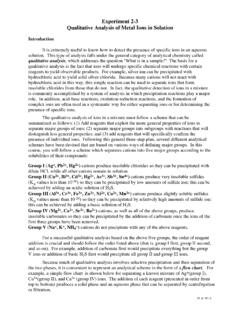
Experiment 2-3 Qualitative Analysis of Metal Ions in Solution
web.williams.eduII & III-1 Experiment 2-3 Qualitative Analysis of Metal Ions in Solution Introduction It is extremely useful to know how to detect the presence of specific ions in an aqueous solution. This type of analysis falls under the general category of analytical chemistry called qualitative analysis, which addresses the question "What is in a sample ...

The Method of Least Squares - Williams College
web.williams.edu3 The Method of Least Squares 4 1 Description of the Problem Often in the real world one expects to find linear relationships between variables. For example, the force of a spring linearly depends on the displacement of the spring: y = kx (here y is the force, x is the displacement of the spring from rest, and k is the spring constant). To test
Related documents

DESIGN GUIDE - Energy Piping Systems
plasticpipe.orgDESIGN GUIDE Residential PEX Water Supply Plumbing Systems Second Edition Prepared for Plastics Pipe Institute, Inc (PPI) 105 Decker Court Suite 825
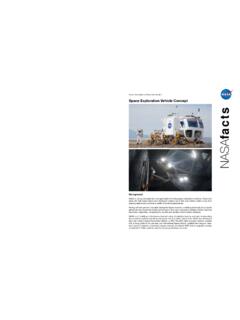
Space Exploration Vehicle Fact Sheet - NASA
www.nasa.govIce-shielded Lock / Fusible Heat Sink: Lock surrounded by 2.5 cm of frozen water provides radiation protection. Same ice is used as a fusible heat sink, rejecting heat energy by melting ice instead of evaporating water to vacuum. Pressurized Rover: Low-mass, low-volume design makes it possible to have two vehicles on a planetary lunar