Calculating Standard Errors and Confidence Intervals
The following are examples of confidence intervals: A 90% confidence interval is the range from 1.645 standard errors below the estimate to 1.645 standard errors above the estimate. The true population value is unknown, but there is an approximate 90% probability that the interval includes or “covers” the true population value.
Download Calculating Standard Errors and Confidence Intervals

Information
Domain:
Source:
Link to this page:
Documents from same domain
THE EMPLOYMENT SITUATION—JUNE 2018
www.bls.gov-2- 204,000 to 2.1 million. (Reentrants are persons who previously worked but were not in the labor force prior to beginning their job search.) (See table A-11.)
Employer-Reported Workplace Injuries and …
www.bls.gov2 Chart 2. Nonfatal occupational injury and illness incidence rates by selected private industry sector, 2003-16 Four private industry sectors—construction, manufacturing, wholesale trade, and retail trade—
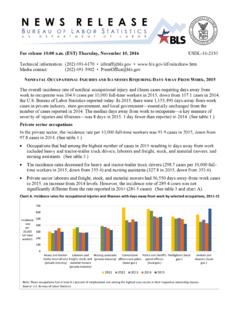
NONFATAL OCCUPATIONAL INJURIES AND …
www.bls.govState and local government occupations The incidence rates for nonfatal occupational injuries and illnesses with days away from work for state
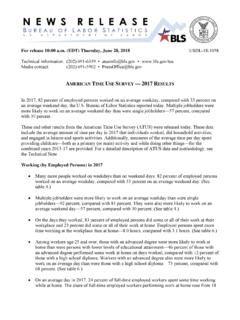
AMERICAN TIME USE SURVEY—2017 RESULTS
www.bls.govTechnical Note . The estimates in this news release are based on annual average data from the American Time Use Survey (ATUS). The ATUS, which is conducted by the U.S. Census Bureau
American Time Use Survey Questionnaire
www.bls.govThe American Time Use Survey (ATUS) is the first federally funded, continuous survey designed to measure time use in the United States. The …
Persons with a Disability: Labor Force Characteristics …
www.bls.govTable A. Employment status of the civilian noninstitutional population by disability status and age, 2016 and 2017 annual averages [Numbers in thousands]
Consumer Price Index - June 2018
www.bls.gov-2 - Table A. Percent changes in CPI for All Urban Consumers (CPI-U): U.S. city average Seasonally adjusted changes from preceding month Un- adjusted
Page 1 of 4 U.S. Department of Labor Bureau of …
www.bls.govPage 1 of 4 790EbookCol.dotx U.S. Department of Labor . Bureau of Labor Statistics . Data Collection Center . Phone: Fax: January 20, 2018 . Dear: Thank you for your willingness to continue participating in the CES survey.
EMPLOYMENT PROJECTIONS 2016-26
www.bls.gov- 2 - employment projections for the 2016–26 decade. The updated OOH is available online at www.bls.gov/ooh. Highlights of the BLS projections for the labor force, macroeconomy, industry employment, and
National Census of Fatal Occupational Injuries in …
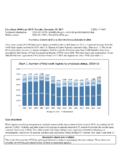
www.bls.gov2 • Fatal work injuries involving violence and other injuries by persons or animals increased by 163 cases to 866 in 2016. Workplace homicides increased by 83 cases to 500 in 2016, and workplace suicides increased
Related documents
Probability and Statistics Vocabulary List (Definitions ...
online.math.uh.edu• Confidence interval – an interval, calculated from a sample, which contains the value of a certain population parameter with a specified probability. • Confidence level - the probability that the statistician's confidence interval contains the true, unknown population parameter.
Normal Distribution, Confidence Intervals for the Mean ...
webspace.ship.eduUse a 2-tailed probability of 0.05 (1 – 0.95). Again, we use the 2-tailed values since we are calculating confidence intervals that lie above and below the mean.

Machine Learning Basics: Estimators, Bias and Variance
cedar.buffalo.eduprobability that true expectation falls in any chosen interval • Ex: 95% confidence interval centered on mean is • ML algorithm A is better than ML algorithm B if – upperbound of A is less than lower bound of B µˆ m µˆ m −1.96SEµˆ (m),µˆ m +1.96SEµˆ ((m))
Common types of clinical trial design, study objectives ...
www.ema.europa.eu• The p-value is the probability of this data (or more extreme) IF H 0 IS TRUE. ... Common types of clinical trial design, study objectives, randomisation and blinding, hypothesis testing, p-values and confidence intervals, sample size calculation
Confidence Interval Solutions - Duke University
sites.nicholas.duke.educonfidence interval is probably not the appropriate tool to make inferences about the true mean mpg. 6. True or False: The population mean (μ) is a random variable that will fall within a confidence interval with 95% probability (with repeated sampling). FALSE. The population mean is NOT a random variable but a population parameter.

Exam Questions - Confidence Intervals
www.toothillschool.co.ukState the probability that neither of these confidence intervals will contain u. (l mark) It is also proposed that, from a third random sample of 50 tubs, a 99% confidence interval for be constructed and that, from a fourth independent, random sample of 50 tubs, a 90% confidence interval for be constructed.

A Practical Guide for Interpreting Confidence Intervals
www.afit.eduFigure 4 shows 90% confidence intervals from samples of size 50. The intervals in . Figure 4 are more precise that the intervals in Figure 2, but have the same level of accuracy. The narrower intervals reflect the increased information from the larger sample. Sample Size for Confidence Intervals

Point-Biserial and Biserial Correlations
ncss-wpengine.netdna-ssl.comThis procedure calculates estimates, confidence intervals, and hypothesis tests for both the point-biserial and the biserial correlations. The point-biserial correlation is a special case of the product -moment correlation in which one variable is continuous and the …

Chapter 7: Statistical Analysis Data Treatment and Evaluation
web.iyte.edu.trFinding the confidence interval when is known or s is a good estimate of The confidence level (CL) is the probability that the true mean lies within a certain interval and is often expressed as a percentage. Figure 7-1c the confidence level is 90% and the confidence interval is from …