Canonical Correlation a Tutorial
In this case, the relation between SNR and correlation is S N = 2 1 2: (17) This relation between correlation and SNR is illustrated in figure 1 (bottom). A Explanations A.1 A note on correlation and covariance matrices In neural network literature, the matrix C xx in equation 3 is often called a corre-lation matrix. This can be a bit ...
Download Canonical Correlation a Tutorial

Information
Domain:
Source:
Link to this page:
Documents from same domain
b r a c e - Carnegie Mellon School of Computer …
www.cs.cmu.eduApproaches to inference Exact inference algorithms The elimination algorithm Belief propagation The junction tree algorithms (but will not cover in detail here)
Sponsored Search Acution Design Via Machine …
www.cs.cmu.eduMaria-Florina Balcan 03/30/2015 Semi-Supervised Learning Readings: • Semi-Supervised Learning. Encyclopedia of Machine Learning. Jerry Zhu, 2010

2 Information and Communications Technology (ICT)
www.cs.cmu.edu2 Information and Communications Technology ... Perspectives of Information and Communication Technologies in Development.” Swiss Agency for Development and
The glEnd() of Zelda
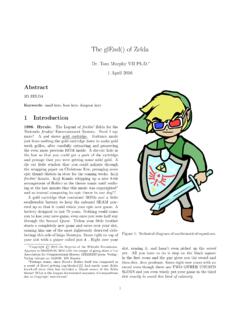
www.cs.cmu.eduThe glEnd() of Zelda Dr. Tom Murphy VII Ph.D. 1 April 2016 Abstract 3D ZELDA ... and the PPU is the Legend of Zelda. It’s just an anal-ogy.

Understanding Understanding Source Code with …
www.cs.cmu.eduUnderstanding Understanding Source Code with Functional Magnetic Resonance Imaging Janet Siegmundˇ, Christian Kästner!, Sven Apelˇ, Chris Parnin , Anja Bethmann , Thomas Leich , Gunter Saake˙, and André Brechmann ˇUniversity of Passau, Germany!Carnegie Mellon University, USA
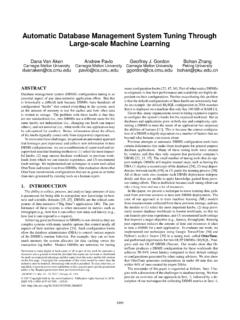
Automatic Database Management System Tuning …
www.cs.cmu.eduAutomatic Database Management System Tuning Through Large-scale Machine Learning Dana Van Aken Andrew Pavlo Geoffrey J. Gordon Bohan Zhang Carnegie Mellon University Carnegie Mellon University Carnegie Mellon University Peking University

www.cs.cmu.edu
www.cs.cmu.eduHappy Holidays from the Myers Family, 2014 Ryan, Reid, Bernita, Brad, Grant and Ethan. (posing in front of a Portrait of Art Rooney, founding owner of the Steelers.)
Model Selection - Carnegie Mellon School of …
www.cs.cmu.eduModel Selection Machine Learning • Def: (loosely) a modeldefines the hypothesis space over which learning performs its search • Def: model parameters are the numeric values or structure selected by the learning algorithm

Sample Invitation to participate in the research …
www.cs.cmu.eduSample Invitation to participate in the research project titled: “Understanding and Broadening the Images of Computing” Dear (computer science student),
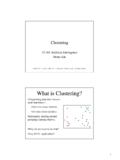
15-381 Artificial Intelligence Henry Lin
www.cs.cmu.edu1 Clustering 15-381 Artificial Intelligence Henry Lin Modified from excellent slides of Eamonn Keogh, Ziv Bar-Joseph, and Andrew Moore • …
Related documents
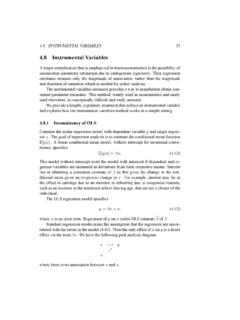
4.8 Instrumental Variables
cameron.econ.ucdavis.eduWhat are the consequences of this correlation between x and u? Now higher levels of x have two effects on y. From (4.43) there is both a direct effect via x and an indirect effect via u effecting x which in turn effects y. The goal of regression is to estimate only the rst effect, yielding an estimate of . The OLS

Covariance, Regression, and Correlation
nitro.biosci.arizona.eduCOVARIANCE, REGRESSION, AND CORRELATION 39 REGRESSION Depending on the causal connections between two variables, xand y, their true relationship may be linear or nonlinear. However, regardless of the true pattern of association, a linear model can always serve as a first approximation. In this case, the analysis is particularly simple, y= fi ...

A Simple Explanation of Partial Least Squares
users.cecs.anu.edu.auFact 12. One way to compute the principal components of a matrix X is to perform singular value decomposition, which gives X = UP T; where U is an n nmatrix made up of the eigenvectors of XXT, P is an m mmatrix made up of the eigenvectors of XTX (i.e., the principal components), and is an n mdiagonal matrix made up of the square roots of the non-zero eigenvalues of both XTX and XXT.
Correlation and Regression
educ.jmu.edu1 Correlation and Regression Basic terms and concepts 1. A scatter plot is a graphical representation of the relation between two or more variables. In the scatter plot of two variables x and y, each point on the plot is an x-y pair. 2. We use regression and correlation to describe the variation in one or more variables. A. The variation is the sum

Linear Mixed-Effects Regression - Statistics
users.stat.umn.eduNesting typically introduces correlation into data at level-1 Students are level-1 and schools are level-2 Dependence/correlation between students from same school We need to account for this dependence when we model the data. Nathaniel E. Helwig (U of Minnesota) Linear Mixed-Effects Regression Updated 04-Jan-2017 : Slide 8
Lecture 8a: Spurious Regression
www.fsb.miamioh.eduThe traditional statistical theory holds when we run regression using (weakly or covariance) stationary variables. For example, when we regress one stationary series onto another stationary series, the coefficient will be close to zero and insignificant if the two series are independent.
Multivariate Regression (Chapter 10)
math.unm.eduMultivariate regression As in the univariate, multiple regression case, you can whether subsets of the x variables have coe cients of 0. In this case, there is a matrix in the null hypothesis, H 0: B d = 0. The E and H matrices are given by E = Y0Y Bb0X0Y H = bB0X0Y Bb0 rX 0 rY And the test statistics are given as before.
Correlation in Random Variables
www.cis.rit.eduCorrelation Coefficient The covariance can be normalized to produce what is known as the correlation coefficient, ρ. ρ = cov(X,Y) var(X)var(Y) The correlation coefficient is bounded by −1 ≤ ρ ≤ 1. It will have value ρ = 0 when the covariance is zero and value ρ = ±1 when X and Y are perfectly correlated or anti-correlated. Lecture 11 4
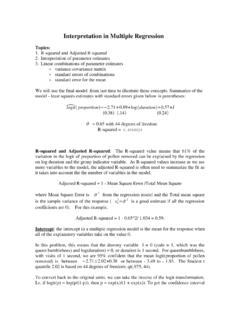
Interpretation in Multiple Regression
www2.stat.duke.eduestimates (recall the correlation is the covariance divided by the product of the standard deviations, so the covariance is the correlation times the product of the standard deviations. Since the standard deviations are unknown, we use the estimated covariance matrix calculated using the standard errors. In the Results options for Regression, check