
Chapter 11: Chi-Square and ANOVA Tests
the Chi-Square Test for Dependence, but for historical reasons it is known as the test for independence. Just as with previous hypothesis tests, all the steps are the same except for the assumptions and the test statistic. Hypothesis Test for Chi-Square Test 1. State the null and alternative hypotheses and the level of significance
Download Chapter 11: Chi-Square and ANOVA Tests

Information
Domain:
Source:
Link to this page:
Documents from same domain
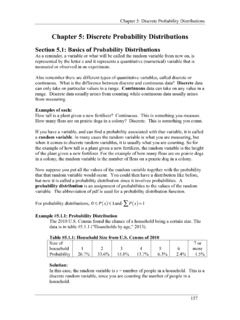
Chapter 5: Discrete Probability Distributions
coconino.eduChapter 5: Discrete Probability Distributions 158 This is a probability distribution since you have the x value and the probabilities that go with it, all of the probabilities are between zero and one, and the sum of all of the probabilities is one. You can give a probability distribution in table form (as in table #5.1.1) or as a graph.
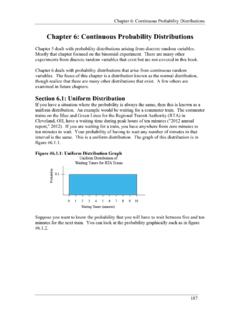
Chapter 6: Continuous Probability Distributions
coconino.eduChapter 6: Continuous Probability Distributions 193 Section 6.3: Finding Probabilities for the Normal Distribution The Empirical Rule is just an approximation and only works for certain values. What if you want to find the probability for x values that are not integer multiples of the standard deviation? The probability is the area under the curve.
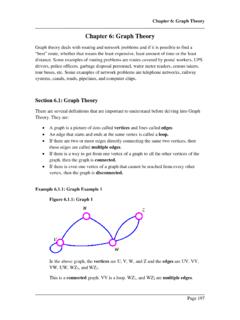
Chapter 6: Graph Theory
coconino.eduLeonhard Euler first discussed and used Euler paths and circuits in 1736. Rather than finding a minimum spanning tree that visits every vertex of a graph, an Euler path or circuit can be used to find a way to visit every edge of a graph once and only once. This would be useful for checking parking meters along the streets of a city, patrolling the

Chapter 10: Regression and Correlation
coconino.eduChapter 10: Regression and Correlation 346 The independent variable, also called the explanatory variable or predictor variable, is the x-value in the equation.The independent variable is the one that you use to predict what the other variable is. The dependent variable depends on what independent value you pick.
Chapter 9: Apportionment - Coconino Community College
coconino.eduSection 9.1 Basic Concepts of Apportionment and Hamilton’s Method . Apportionment can be thought of as dividing a group of people (or other resources) and assigning them to different places. Example 9.1.1: Why We Need Apportionment. Tom is moving to a new apartment. On moving day, four of his friends come to
Related documents

How to Use SPSS for Contingency Table, Relative Risk, Odds ...
gchang.people.ysu.eduContingency Table and Chi-square Test 1 How to Use SPSS for Contingency Table, Relative Risk, Odds Ratio and Chi-Square Test Example: Suppose we conducted a prospective cohort study to investigate the effect of aspirin on heart disease. A group of patients who are at risk for a heart attack are randomly assigned to either a placebo or aspirin.

Chapter 7 Pearson’s chi-square test
personal.psu.eduPearson’s chi-square test 7.1 Null hypothesis asymptotics Let X 1,X 2,··· be independent from a multinomial(1,p) distribution, where p is a k-vector with nonnegative entries that sum to one. That is, P(X ij = 1) = 1−P(X ij = 0) = p j for all 1 ≤ j ≤ k (7.1) and each X i consists of exactly k−1 zeros and a single one, where the one ...

Difference between a T-test and Chi Square T-test
pages.ucsd.eduChi Square: Allows you to test whether there is a relationship between two variables. BUT, it does not tell you the direction or the size of the relationship. Null Hypothesis: There is no relationship between the two variables. When you reject the null hypothesis with a Chi-Square, you are saying that there is a relationship between the two ...

Lecture 6 Chi Square Distribution (c) and Least Squares ...
www.asc.ohio-state.eduK.K. Gan L6: Chi Square Distribution 2 u One can show that the probability distribution for c2 is exactly: n This is called the "Chi Square" (c2) distribution. H G is the Gamma Function: n This is a continuous probability distribution that is a function of two variables: H c2 H Number of degrees of freedom (dof): n = # of data points - # of parameters calculated from the data points

T-test, f-test, Z-test ,chi square test. - Chanakya
www.chanakyagroupofeconomics.comChi square test Χtest is sampling analysis for testing significance of population variance. 2 Chi square is non parametric test, it can be used for test of goodness of fit r . Chi square test is use simple random sampling method. Χtest is introduced by- Karl Pearson.. 2 Chi square test’s value lies bw 0 to 1. 2

ANALYSING LIKERT SCALE/TYPE DATA.
www.st-andrews.ac.ukChi-square test. 3. Likert scale. A Likert scale is composed of a series of four or more Likert-type items that represent similar questions combined into a single composite score/variable. Likert scale data can be analyzed as interval data, i.e. the mean is the best

The Chi Square Test - University of West Georgia
www.westga.eduThe chi-square test for a two-way table with r rows and c columns uses critical values from the chi-square distribution with ( r – 1)(c – 1) degrees of freedom. The P-value is the area under the density curve of this chi -square distribution to the right of the value

Interpreting Tables and Chi-square - Iowa State University
www2.econ.iastate.eduComputing Chi‐Squared Chi-Square Calculations Ever Divorced? Do You Smoke? Yes No Total Yes 20 320.3 11 811.8 No 8.3 4.8 45.3 Converting to a measure of association: Cramers phi 1. N = 1669 2. Cramers phi = square root of Chi-squared divided by N 3. so, 45.3 / 1669 = 0.0271372 4. The square root of 3 is Cramers phi 0.1647337 Reporting The Result