
Chapter 2: Frequency Distributions and Graphs (or making ...
Ch2: Frequency Distributions and Graphs Santorico -Page 27 Section 2-1 – Organizing Data Data must be organized in a meaningful way so that we can use it effectively. This is often a pre-cursor to creating a graph. Frequency distribution – the organization of raw data in table form, using classes and frequencies.
Download Chapter 2: Frequency Distributions and Graphs (or making ...

Information
Domain:
Source:
Link to this page:
Documents from same domain

A demo using PETSc - UC Denver
math.ucdenver.eduDistributed Kernel Finite Difference A demo using PETSc Michael McCourt mccourt@sigopt.com

SYLLABUS - MATH 3200: Elementary Differential …
math.ucdenver.eduMath 3200 – Spring 2014 Page 3 mistakes are usually discounted at half a point per mistake unless your arithmetic mistake totally trivializes the problem in which case the deduction will be severe.
MATH 4310 :: Introduction to Real Analysis I :: Spring ...
math.ucdenver.eduSo, combining 0 liminf js nj liminf js nj limsupjs nj limsupjs nj= 0 leads us to: 0 liminf js nj limsupjs nj= 0; which leads to liminf js nj= limsupjs nj= 0: By Theorem 10.7.ii, we conclude that limjs nj= 0: …

Hadamard Matrices and Designs
math.ucdenver.eduHadamard matrix are permuted, the matrix remains Hadamard. It is also true that if any row or column is multiplied by -1, the Hadamard property is retained. [Prove this] Thus, it is always possible to arrange to have the first row and first column of an Hadamard matrix contain only +1 entries. An Hadamard matrix in this form is said to be ...

Combinatorial Proofs
math.ucdenver.eduBinomial Theorem Notice that each term of the binomial expansions is a product composed of one item of each color. This suggests another way to look at this process of multiplication. Think of each factor in the product as a box containing two items, an x and a y (the colors are used here to keep track of which box an x or a y came from). We
Chapter 2: Frequency Distributions and Graphs (or making ...
math.ucdenver.eduFrequency distribution – the organization of raw data in table form, using classes and frequencies. Class – a quantitative or qualitative category. A class may be a range of numerical values (that acts like a “category”) or an actual category. Frequency – the number of data values contained in a specific class.
Finite Fields - Mathematical and Statistical Sciences
math.ucdenver.eduConstructing Finite Fields Another idea that can be used as a basis for a representation is the fact that the non-zero elements of a finite field can all be written as powers of a primitive element. Example: Let ω be a primitive element of GF(4). The elements of GF(4) are then 0, ω, ω2, ω3. Multiplication is easily done in this

Tutorial for the R Statistical Package
math.ucdenver.eduThis software can also be downloaded for free by anyone from various sites around the world. Let’s first start by downloading and installing R on your machine. After con-necting to the internet go to: www.r-project.org. From here select CRAN from the menu on the left side of the page. On the next page select a mirror from
Related documents

Using Graphs and Charts to Illustrate No. 12 | updated ...
www.cdc.govBar graphs, line graphs, and histograms have an x- and y-axis. The x-axis is the horizontal part of the graph and . the y-axis is the vertical part. Types of Graphs and Charts • A . bar graph. is composed of discrete bars . that represent different categories of data. The length or height of the bar is equal to the quantity within that ...
2. Graphical Transformations of Functions
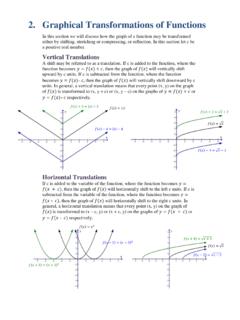
michelenaja.faculty.mjc.eduof is transformed to (x, y + c) or (x, y – c) on the graphs of or – respectively. Horizontal Translations If c is added to the variable of the function, where the function becomes , then the graph of will horizontally shift to the left c units. If c is subtracted from the variable of the function, where the function becomes ...
![arXiv:1706.02216v4 [cs.SI] 10 Sep 2018](/cache/preview/9/a/6/8/0/7/1/d/thumb-9a68071d73afd8997ff3a74956baa9eb.jpg)
arXiv:1706.02216v4 [cs.SI] 10 Sep 2018
arxiv.orggraphs (e.g., citation data with text attributes, biological data with functional/molecular markers), our approach can also make use of structural features that are present in all graphs (e.g., node degrees). Thus, our algorithm can also be applied to graphs without node features.

INTRODUCTION TO RANDOM GRAPHS - CMU
www.math.cmu.eduRandom graphs were used by Erdos [285] to give a probabilistic construction of˝ a graph with large girth and large chromatic number. It was only later that Erdos˝ and Renyi began a systematic study of random graphs as objects of interest in their´ own right. Early on they defined the random graph G n;m and founded the subject.

How to create graphs with a “best fit line” in Excel
www.utsa.eduHow to create graphs with a “best fit line” in Excel . 2In this manual, we will use two examples: y = x, a linear graph; and y = x, a non-linear graph. The y-values were specifically chosen to be inexact to illustrate what you will see when you analyze data from your labs.

Describing Distributions - With Graphs or Tables
faculty.washington.edu3.3 Bar Graphs for Qualitative Data On a scale of 1-10, how nervous are you about taking STAT 220? (1=very nervous, 10=not nervous) Bar graphs represent each category as a bar. The bar heights show the category counts or percents. Bar graphs can compare quantities that are not part of a whole. A Pareto bar graph has the bars ordered from ...

The Basics of Creating Graphs with SAS/GRAPH Software Jeff ...
support.sas.comThe Basics of Creating Graphs with SAS/GRAPH® Software Jeff Cartier, SAS Institute Inc., Cary, NC ABSTRACT SAS/GRAPH software is a very powerful tool for creating a wide range of business and scientific graphs. This presentation provides an overview the types of graphs that can be produced with SAS/GRAPH software and the basic procedure syntax for

1.10 Matrix Representation of Graphs
staff.ustc.edu.cn42 Basic Concepts of Graphs 1.10 Matrix Representation of Graphs Definitions: In this section, we introduce two kinds of matrix representations of a graph, that is, the adjacency matrix and incidence matrix of the graph. A graph Gwith the vertex-set V(G) = {x1,x2,···,vv} can be described by means of matrices. The adjacency matrix of Gis a v ...

WUCT121 Discrete Mathematics Graphs Tutorial Exercises ...
documents.uow.edu.auWUCT121 Graphs: Tutorial Exercise Solutions 3 Question2 Either draw a graph with the following specified properties, or explain why no such graph exists: (a) A graph with four vertices having the degrees of its vertices 1, 2, 3 and 4. (b) A simple graph with five vertices with degrees 2, 3, 3, 3, and 5. It is impossible to draw this graph. A simple graph has no parallel edges nor any

Bipartite Graphs and Problem Solving
math.uchicago.edu2 Properties of General Graphs and Introduction to Bipartite Graphs Every graph has certain properties that can be used to describe it. An important property of graphs that is used frequently in graph theory is the degree of each vertex. The degree of a vertex in G is the number of vertices adjacent to it, or, equivalently,