Chapter 2. Order Statistics
Chapter 2. Order Statistics 1 The Order Statistics For a sample of independent observations X 1,X 2,...,X n on a distribution F, the ordered sample values X (1) ≤ X ... for many useful statistics, the most natural and efficient representations are in terms of order statistics. Examples are the extreme values X 1:n and X n:n and the sample range X
Download Chapter 2. Order Statistics

Information
Domain:
Source:
Link to this page:
Documents from same domain
MATHEMATICAL MODELING AND ORDINARY …
www.math.ntu.edu.twMATHEMATICAL MODELING AND ORDINARY DIFFERENTIAL EQUATIONS I-Liang Chern Department of Mathematics National Taiwan University 2007, 2015 January 6, 2016

Methods in Applied Mathematics - 國立臺灣大學
www.math.ntu.edu.twChapter 1 Dimensional Analysis 1.1 The program of applied mathematics The program of applied mathematics consists of the following procedures. Observe a phenomenon, determine variables (quantities) that we are concerned with.

Lecture 2 : Basics of Probability Theory
www.math.ntu.edu.twLecture 2 : Basics of Probability Theory When an experiment is performed, the realization of the experiment is an outcome in the sample space. If the experiment is performed a number of times, different outcomes may occur each time or some outcomes may repeat. This “frequency of occurrence” of an outcome can be thought of as a probability.
Partial Differential Equation Toolbox User's Guide
www.math.ntu.edu.twFor Use with MATLAB® User’s Guide Computer Solutions Europe AB. How to Contact The MathWorks: 508-647-7000 Phone ... A nonlinear solver is available for the nonlinear elliptic PDE ... solver for Poisson’s equation on a rectangular grid is available. – ∇⋅()cu∇+au = f ...

第 9 章 無窮級數 (Infinite Series)
www.math.ntu.edu.tw第9 章無窮級數 9.1 數列 (4) 若an ‚ an+1,8n, 則稱fang 為非上升數列 (nondecreasing sequence)。 (5) fang 為上升或下降數列, 則統稱為單調 (monotonic)。 (6) 若存在 N, 使得 an < an+1,8 n > N, 則稱fang 為終極上升 (ultimately increasing) 數列 定義 9.1.19. (1) 若存在 M, 使得 an • M,8n, 則稱fang 為有上界 (bounded above), 且 M

FINITE DIFFERENCE METHODS FOR SOLVING DIFFERENTIAL …
www.math.ntu.edu.twFINITE DIFFERENCE METHODS FOR SOLVING DIFFERENTIAL EQUATIONS I-Liang Chern Department of Mathematics National Taiwan University May 16, 2013
1 Order Statistics - 國立臺灣大學
www.math.ntu.edu.tw1 Order Statistics Definition The order statistics of a random sample X1,...,Xn are the sample values placed in ascending order. They are denoted by X(1),...,X(n). The order statistics are random variables that satisfy X(1) ≤ X(2) ≤ ··· ≤ X(n). The following are some statistics that are easily defined in terms of the order statistics.
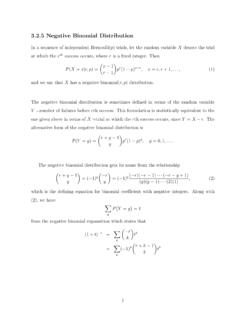
3.2.5 Negative Binomial Distribution - 國立臺灣大學
www.math.ntu.edu.twThe negative binomial distribution is sometimes defined in terms of the random variable Y =number of failures before rth success. This formulation is statistically equivalent to the one given above in terms of X =trial at which the rth success occurs, since Y = X −r. The
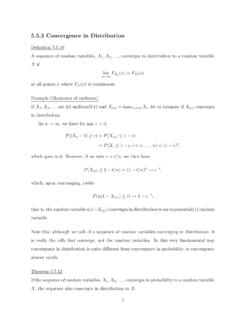
5.5.3 Convergence in Distribution
www.math.ntu.edu.twIf Xn → X in distribution and Yn → a, a constant, in probability, then (a) YnXn → aX in distribution. (b) Xn +Yn → X +a in distribution. Example (Normal approximation with estimated variance) Suppose that √ n(X¯ n −µ) σ → N(0,1), but the value σ is unknown. We know Sn → σ in probability. By Exercise 5.32, σ/Sn → 1 in ...

4.2 Conditional Distributions and Independence
www.math.ntu.edu.tw4.2 Conditional Distributions and Independence Definition 4.2.1 Let (X,Y) be a discrete bivariate random vector with joint pmf f(x,y) and marginal pmfs fX(x) and fY (y). For any x such that P(X = x) = fX(x) > 0, the conditional pmf of Y given that X = …
Related documents
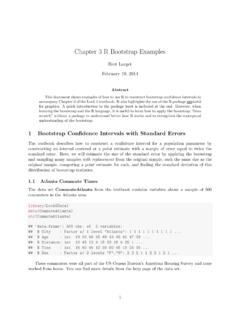
Chapter 3 R Bootstrap Examples - University of Wisconsin ...
pages.stat.wisc.eduChapter 3 R Bootstrap Examples Bret Larget February 19, 2014 Abstract This document shows examples of how to use R to construct bootstrap con dence intervals to accompany Chapter 3 of the Lock 5 textbook. It also highlights the use of the R package ggplot2 for graphics. A quick introduction to the package boot is included at the end. However, when

Solutions Manual for Statistical Inference, Second Edition
www.ams.sunysb.eduChapter 1 Probability Theory “If any little problem comes your way, I shall be happy, if I can, to give you a hint or two as to its solution.” Sherlock Holmes The Adventure of the Three Students 1.1 a. Each sample point describes the result of the toss (H or T) for each of the four tosses. So,

Chapter Four: Univariate Statistics SPSS V11 - SSRIC
ssric.orgChapter Four: Univariate Statistics SPSS V11 Chapter Four: Univariate Statistics Univariate analysis, looking at single variables, is typically the first procedure one does when examining first time data. There are a number of reasons why it is the …

Chapter 4 Exploratory Data Analysis - CMU Statistics
stat.cmu.eduChapter 4 Exploratory Data Analysis A rst look at the data. As mentioned in Chapter 1, exploratory data analysis or \EDA" is a critical rst step in analyzing the data from an experiment. Here are the main reasons we use EDA: detection of mistakes checking of assumptions preliminary selection of appropriate models
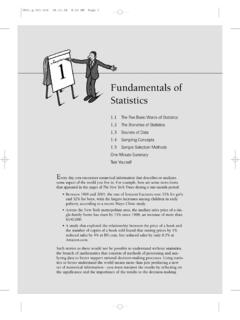
Fundamentals of Statistics - Pearson
www.pearsonhighered.comsion-making processes today. Reading this chapter will help you understand the fundamentals of statistics and introduce you to concepts that are used throughout this book. The Five Basic Words of Statistics The five words population, sample, parameter, statistic (singular), and variable form the basic vocabulary of statistics.
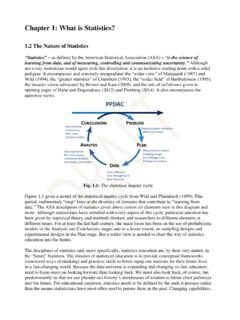
Chapter 1: What is Statistics? D - Auckland
www.stat.auckland.ac.nzChapter 1: What is Statistics? 1.2 The Nature of Statistics “Statistics” as defined by the American Statistical Association (ASA) “is the science of learning from data, and of measuring, controlling and communicating uncertainty.