Chapter 4 Multivariate distributions
RS – 4 – Multivariate Distributions 1 Chapter 4 Multivariate distributions k ≥2 Multivariate Distributions All the results derived for the bivariate case can be generalized to n RV. The joint CDF of X1, X2, …, Xk will have the form: P(x1, x2, …, xk) when the RVs are discrete F(x1, x2, …, xk) when the RVs are continuous
Download Chapter 4 Multivariate distributions

Information
Domain:
Source:
Link to this page:
Documents from same domain

MANA6A32 Organizational Behavior and …
www.bauer.uh.eduorganizational behavior (OB) and management. You will be familiar with major concepts of OB and management, the determinants and implications of various behaviors in organizations, and

EMBA: MANA 6332 – Organizational Behavior
www.bauer.uh.eduOrganizational Behavior or Human Resource Management. Presentations are worth 30 points each. Half of the points are a group score based on content and overall timeliness.

Production and Operations Management
www.bauer.uh.eduOperations Management (OM) is the study of how organizations employ their resources to produce goods and services to satisfy customer demands. This business process is known as the supply chain, and the planning and

MANA 7338: Power, Politics, and Culture in Organizations
www.bauer.uh.eduto sources of power, challenges to acquiring sources of power, factors that call for particular influence tactics). Using your analysis as a foundation, your remaining task in writing the final paper will be to
Using Amos for structural equation modeling in market …
www.bauer.uh.eduwhite paper Using Amos for structural equation modeling in market research 2 ® S tructural equation models (SEMs) describe relationships between variables.

CHAPTER XII INTERNATIONAL BOND MARKETS
www.bauer.uh.eduCHAPTER XII INTERNATIONAL BOND MARKETS Despite the complexity associated with the bond market, a bond is simple and it might be consider a bit boring when compared with a stock. After all, a stock represents a piece of a company's wealth.
Lecture 5 Multiple Choice Models Part I –MNL, Nested Logit
www.bauer.uh.edu1 Lecture 5 Multiple Choice Models Part I –MNL, Nested Logit DCM: Different Models •Popular Models: 1. ProbitModel 2. Binary LogitModel ... 1 for engineer, 2 for lawyer, etc. (categories)-Opinions are usually coded with scales, where 1 stands for ... 2.016 (21.33) BL β1

Lecture 12 Nonparametric Regression
www.bauer.uh.eduThat is, a kernel regression estimator is a local constant regression, since it sets m(x) equal to a constant, θ, in the very small neighborhood of x0: Note: The residuals are weighted quadratically => weighted LS! ... using the density estimation results.

Lecture 13 Time Series: Stationarity, AR(p) & MA(q)
www.bauer.uh.eduThe correlation between any two RVs depends on the time difference. ( ) , (2t) E Zt E Z Then, Time Series – Moments • A process is said to be N-order weakly stationaryif all its joint moments up to orderN exist and are time invariant. • A Covariance stationaryprocess (or 2nd order weakly stationary) has: - constant mean - constant variance
COUNTRY RISK ANALYSIS
www.bauer.uh.eduCredit rating agencies describe (measur e) the risk with a credit rating (a letter grade). Rule: The higher the grade, the lowe r the yield of the bond (measured as a spread over risk-free rate). (For us, the risk-free rate is the yield of government bonds).
Related documents

Chapter 5: JOINT PROBABILITY DISTRIBUTIONS Part 1 ...
homepage.stat.uiowa.eduThere are 6 possible pairs (X;Y). We show the probability for each pair in the following table: x=length 129 130 131 y=width 15 0.12 0.42 0.06 16 0.08 0.28 0.04
Chapter 7 Continuous Distributions - Yale University
www.stat.yale.edu7. Continuous Distributions 5 Example <7.5> Zero probability for ties with continuous distributions. Calculations are also greatly simpli ed by the fact that we can ignore contributions from higher order terms when working with continuous distri-butions and small intervals. Example <7.6> The distribution of the order statistics from the uniform
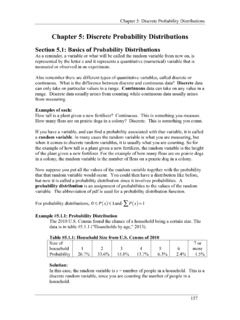
Chapter 5: Discrete Probability Distributions
coconino.eduChapter 5: Discrete Probability Distributions 158 This is a probability distribution since you have the x value and the probabilities that go with it, all of the probabilities are between zero and one, and the sum of all of the probabilities is one. You can give a probability distribution in table form (as in table #5.1.1) or as a graph.
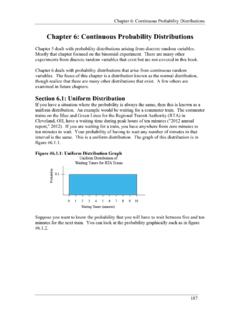
Chapter 6: Continuous Probability Distributions
coconino.eduChapter 6: Continuous Probability Distributions 193 Section 6.3: Finding Probabilities for the Normal Distribution The Empirical Rule is just an approximation and only works for certain values. What if you want to find the probability for x values that are not integer multiples of the standard deviation? The probability is the area under the curve.

CHAPTER 3: Random Variables and Probability Distributions
homepage.divms.uiowa.edu1=2 if 4 x < 6 5=6 if 6 x < 10 1 if x 10; nd the probability mass function. Solution: Continuous Probability Distribution: 3.3 A density curve is a curve that is always on or above the horizontal axis, and has area exactly 1 underneath it. A density curve describes the overall pattern of a distribution. The area under the curve and above any

Chapter 3 Continuous Random Variables
www.pnw.eduChapter 3 Continuous Random Variables ... Figure 3.1: Comparing discrete and continuous distributions 73. 74 Chapter 3. Continuous Random Variables (LECTURE NOTES 5) ... Random variable Xis continuous if probability density function (pdf) fis continuous at all but a nite number of points and possesses the following properties: f(x) 0, for all x,
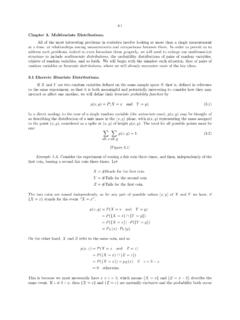
Chapter 3. Multivariate Distributions.
www.stat.uchicago.eduChapter 3. Multivariate Distributions. ... structure to include multivariate distributions, the probability distributions of pairs of random variables, triplets of random variables, and so forth. ... satisfying (3.10) and (3.11) describes a continuous bivariate probability distribution. It can help the intuition to think of a continuous ...