CHAPTER 5 EXAMPLES: CONFIRMATORY FACTOR …
and ordered categorical (ordinal) outcomes, multiple group analysis is specified by using the GROUPING option of the VARIABLE command for individual data or the NGROUPS option of the DATA command for summary data. For censored with maximum likelihood estimation, unordered categorical (nominal), and count outcomes, multiple group
Download CHAPTER 5 EXAMPLES: CONFIRMATORY FACTOR …

Information
Domain:
Source:
Link to this page:
Documents from same domain

Conducting Confirmatory Latent Class Analysis …
www.statmodel.comCONDUCTING CONFIRMATORY LCA USING MPLUS 133 TABLE 1 Taxonomy of Models for Latent Categorical Variables Type of Observed Variable Type of Research Question Categorical Continuous

Identity Statuses as Developmental Trajectories: A …
www.statmodel.comEMPIRICAL RESEARCH Identity Statuses as Developmental Trajectories: A Five-Wave Longitudinal Study in Early-to-Middle and Middle-to-Late Adolescents

Statistical Analysis With Latent Variables User’s …
www.statmodel.comcreating the pictures of the models in the example chapters of the Mplus User’s Guide. She has patiently and quickly changed them time and time again as we have repeatedly changed our minds. She is also responsible for keeping the website updated and

VERSION 5.1 Mplus LANGUAGE ADDENDUM
www.statmodel.com4 Count variables for the zero-truncated negative binomial model must have values greater than zero. Following is the specification of the COUNT option for a negative

Bayesian Analysis In Mplus: A Brief Introduction
www.statmodel.comindirect e ect, a structural equation model, a two-level regression model with estimation of a random intercept variance, a multiple-indicator binary growth model with a large number of latent variables, a two-part growth model, and a mixture model.

Weighted Least Squares Estimation with Missing Data
www.statmodel.comWeighted Least Squares Estimation with Missing Data Tihomir Asparouhov and Bengt Muth en August 14, 2010 1

An Introduction to Latent Class Growth Analysis and Growth ...
www.statmodel.comgrowth mixture modeling is the distinction between person-centered and variable-centered approaches (cf. Muthén & Muthén, 2000). Variable-centered approaches such as regression, factor analysis, and structural equation modeling focus …

Statistical Analysis With Latent Variables User’s Guide
www.statmodel.comCHAPTER 1 2 between variables. The figure below shows the types of relationships ... variables. Regressions relationships that are allowed but not specifically shown in the figure include regressions among observed outcome variables, among continuous latent variables, and among categorical ... Introduction 5 MODELING WITH CATEGORICAL LATENT
CHAPTER 12 EXAMPLES: MONTE CARLO SIMULATION …
www.statmodel.comThe column 3 percentile values are determined from a chi-square distribution with the degrees of freedom given by the model, in this case 5. In this output, the column 1 value of 0.05 gives the probability that the chi-square value exceeds the column 3 percentile value (the critical value of the chi-square distribution) of 11.070.

CHAPTER 3 EXAMPLES: REGRESSION AND PATH ANALYSIS
www.statmodel.comBootstrap standard errors and confidence intervals . CHAPTER 3 20 Wald chi-square test of parameter equalities ... and unequal probability of selection are ... * Example uses numerical integration in the estimation of the model.
Related documents
Linear Regression Analysis for Survey Data
faculty.nps.eduLinear Regression Analysis for Survey Data Professor Ron Fricker Naval Postgraduate School Monterey, California 1. ... • Likert scale data is categorical (ordinal) ... designed for complex survey analysis 18. Population vs. Sample • Sometimes have a census of data: can
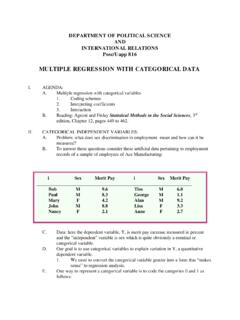
MULTIPLE REGRESSION WITH CATEGORICAL DATA
www1.udel.educategorical variable. D. Our goal is to use categorical variables to explain variation in Y, a quantitative dependent variable. 1. We need to convert the categorical variable gender into a form that “makes sense” to regression analysis. E. One way to represent a categorical variable is to code the categories 0 and 1 as follows:
Data Analysis Basics: Variables and Distribution
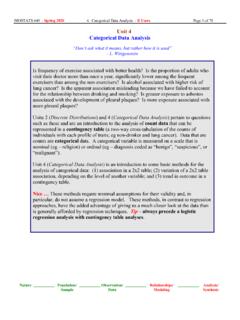
nciph.sph.unc.eduThe data we are trying to code has an inherent order, but the coding in this example does not follow that order. This is not appropriate coding for an ordinal categorical vari-able. For a nominal categorical variable, however, the order makes no difference. Although we code each category with a number, the number does not represent a numeri-cal ...

The 7 Steps of Data Analysis - StatsWhisperer
www.statswhisperer.comMoreover, this book does not only describe the process of data analysis, but applies it. Specifically, The 7 Steps of Data Analysis model is applied to complete two data analysis studies for two reasons. First, these studies are presented to illustrate the many steps, decisions, and challenges encountered when conducing a data analysis study.
Unit 4 Categorical Data Analysis - UMass
people.umass.eduData that are counts are categorical data. A categorical variable is measured on a scale that is nominal (eg – religion) or ordinal (eg – diagnosis coded as “benign”, “suspicious”, or “malignant”). Unit 4 (Categorical Data Analysis) is an introduction to some basic methods for the
An Introduction to Categorical Data Analysis
xn--webducation-dbb.com12 A Historical Tour of Categorical Data Analysis * 325 Appendix: Software for Categorical Data Analysis 331 A.1 R for Categorical Data Analysis 331 A.2 SAS for Categorical Data Analysis 332 A.3 Stata for Categorical Data Analysis 342 A.4 SPSS for Categorical Data Analysis 346 Brief Solutions to Odd-Numbered Exercises 349 Bibliography 363 ...

BCS Level 4 Diploma in Data Analysis Concepts QAN …
www.bcs.orgdata analysis. Objectives Learners should be able to demonstrate knowledge and understanding of Data Analysis and its underlying architecture, principles, and techniques. Key areas are: 1. Explore the different types of data, including open and public data, administrative data, and research data 2. Understand the data lifecycle 3.

Exploratory Data Analysis for Feature Selection in Machine ...
services.google.comRigorous data analysis, focusing on the relationship between features or between features and labels, with rigorous reasoning (theory) Descriptive analysis of each attribute in a dataset for numerical, categorical, and textual attributes Correlation analysis of two attributes (numerical versus numerical,