
Cooling Tower Basics and Common Misconceptions2
This cooling process can best be explained on a Psychometric Chart. The process is shown in figure 2 – known as the Driving Force Diagram. The air film is repre‐ sented by the Water Operating Line on the Saturation Curve. The main air is represented by the Air Operating Line, the slope of which is the Water/Air [L/G] ratio. The cooling ...
Download Cooling Tower Basics and Common Misconceptions2

Information
Domain:
Source:
Link to this page:
Documents from same domain
SATURATED SODIUM CHLORIDE BRINE, DENSITY …
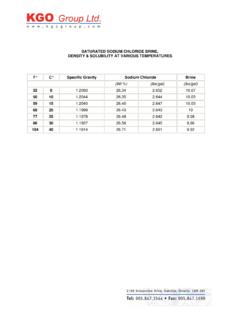
www.kgogroup.comSATURATED SODIUM CHLORIDE BRINE, DENSITY & SOLUBILITY AT VARIOUS TEMPERATURES F° C° Specific Gravity Sodium Chloride Brine (Wt %) …

COOLING TOWERS CATALOGUE - KGO Group Ltd.
www.kgogroup.comguarantee the correct and efficient treatment of water flow in a cooling tower. 8. The control system performs three essential tasks: ... metal’s corrosion factor. Concerning cooling towers treatment, this prevents the deterioration of water pipes and thus keeping the system efficient. ... In water flow it prevents and controls the ...
Related documents

and Process Cooling Water - Miller Leaman
www.millerleaman.comSelling Into Various Applications… • Full flow, side-stream, and slip- stream filtration of cooling tower water • Protection of chillers, heat exchangers, condensers, and other “wet side” components • Process cooling or chilled water filtration

Developing a Water Management Program to Reduce …
www.cdc.govBuilding water systems: Includes hot and cold water distribution and all devices that use water people can be exposed to, such as hot tubs, decorative fountains, and cooling towers Control: To manage the conditions within your building according to your water management program

Cooling Towers - CED Engineering
www.cedengineering.comCooling water systems control these temperatures by transferring heat from hot process fluids into cooling water. As this happens, the cooling water itself gets hot; before it can be used again it must either be cooled or replaced by a fresh supply of cool water. A Cooling Tower is a heat rejection device that extracts waste heat to the