Correlation and Regression
1 Correlation and Regression Basic terms and concepts 1. A scatter plot is a graphical representation of the relation between two or more variables. In the scatter plot of two variables x and y, each point on the plot is an x-y pair. 2. We use regression and correlation to describe the variation in one or more variables. A. The variation is the sum
Download Correlation and Regression

Information
Domain:
Source:
Link to this page:
Documents from same domain
Financial Ratio Analysis - educ.jmu.edu
educ.jmu.eduFinancial ratio analysis A reading prepared by Pamela Peterson Drake O U T L I N E 1. Introduction 2. Liquidity ratios 3. Profitability ratios and activity ratios

Advantage and disadvantages of the different …
educ.jmu.eduProfitability Index Advantages Disadvantages 1. Tells whether an investment increases the firm's value 2. Considers all cash flows of the project
Solutions to Time Value of Money Practice Problems
educ.jmu.eduSolutions to Time value of money practice problems Prepared by Pamela Peterson Drake 1. What is the balance in an account at the end of 10 years if …
Financial Ratio Formulas - educ.jmu.edu
educ.jmu.eduFinancial ratio formulas Prepared by Pamela Peterson Drake 1. Operating cycle Inventory Inventory Number of days of inventory Average day's cost of …
Financial ratio analysis - educ.jmu.edu
educ.jmu.eduBesides financial statement data, market data, and economic data, in financial analysis you also need
Solving simultaneous equations using matrix …
educ.jmu.edu3 Step 3: Multiply matrices You multiply matrices using the MMULTI function, selecting the cells that you want the results (in this example, cells B12, B13 and B14:
Residual income - educ.jmu.edu
educ.jmu.edu1 Residual income A reading prepared by Pamela Peterson Drake James Madison University WHAT IS RESIDUAL INCOME? Analysts can choose from a number of methods to value a company’s equity, including the discounted dividend and
Corporate Strategy - educ.jmu.edu
educ.jmu.eduCorporate strategy is the selection and development of the markets (or industries)1 in which a firm competes. Therefore, corporate strategy deals with what industries (or markets) a firm seeks to compete in. Business level strategies (low cost, differentiation, and focus) that were
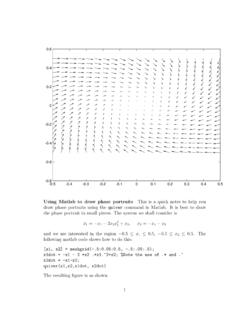
quiver - educ.jmu.edu
educ.jmu.eduUsing Matlab to draw phase portraits This is a quick notes to help you draw phase portraits using the quiver command in Matlab. It is best to draw the phase portrait in …
What is free cash flow and how do I calculate it?
educ.jmu.eduA key cash flow in both analysis and valuation is the cash flow for/from operating activities. This cash flow is calculated by adjusting net income for non-cash expenses and income, as well as for changes in working capital accounts. This
Related documents
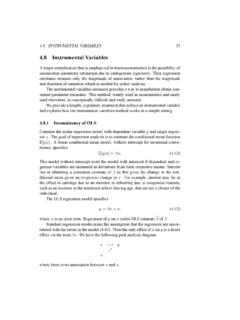
4.8 Instrumental Variables
cameron.econ.ucdavis.eduWhat are the consequences of this correlation between x and u? Now higher levels of x have two effects on y. From (4.43) there is both a direct effect via x and an indirect effect via u effecting x which in turn effects y. The goal of regression is to estimate only the rst effect, yielding an estimate of . The OLS

Covariance, Regression, and Correlation
nitro.biosci.arizona.eduCOVARIANCE, REGRESSION, AND CORRELATION 39 REGRESSION Depending on the causal connections between two variables, xand y, their true relationship may be linear or nonlinear. However, regardless of the true pattern of association, a linear model can always serve as a first approximation. In this case, the analysis is particularly simple, y= fi ...

A Simple Explanation of Partial Least Squares
users.cecs.anu.edu.auFact 12. One way to compute the principal components of a matrix X is to perform singular value decomposition, which gives X = UP T; where U is an n nmatrix made up of the eigenvectors of XXT, P is an m mmatrix made up of the eigenvectors of XTX (i.e., the principal components), and is an n mdiagonal matrix made up of the square roots of the non-zero eigenvalues of both XTX and XXT.

Linear Mixed-Effects Regression - Statistics
users.stat.umn.eduNesting typically introduces correlation into data at level-1 Students are level-1 and schools are level-2 Dependence/correlation between students from same school We need to account for this dependence when we model the data. Nathaniel E. Helwig (U of Minnesota) Linear Mixed-Effects Regression Updated 04-Jan-2017 : Slide 8
Lecture 8a: Spurious Regression
www.fsb.miamioh.eduThe traditional statistical theory holds when we run regression using (weakly or covariance) stationary variables. For example, when we regress one stationary series onto another stationary series, the coefficient will be close to zero and insignificant if the two series are independent.
Multivariate Regression (Chapter 10)
math.unm.eduMultivariate regression As in the univariate, multiple regression case, you can whether subsets of the x variables have coe cients of 0. In this case, there is a matrix in the null hypothesis, H 0: B d = 0. The E and H matrices are given by E = Y0Y Bb0X0Y H = bB0X0Y Bb0 rX 0 rY And the test statistics are given as before.
Correlation in Random Variables
www.cis.rit.eduCorrelation Coefficient The covariance can be normalized to produce what is known as the correlation coefficient, ρ. ρ = cov(X,Y) var(X)var(Y) The correlation coefficient is bounded by −1 ≤ ρ ≤ 1. It will have value ρ = 0 when the covariance is zero and value ρ = ±1 when X and Y are perfectly correlated or anti-correlated. Lecture 11 4
Canonical Correlation a Tutorial
www.cs.cmu.eduIn this case, the relation between SNR and correlation is S N = 2 1 2: (17) This relation between correlation and SNR is illustrated in figure 1 (bottom). A Explanations A.1 A note on correlation and covariance matrices In neural network literature, the matrix C xx in equation 3 is often called a corre-lation matrix. This can be a bit ...
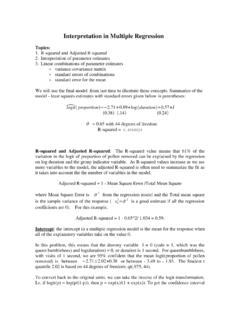
Interpretation in Multiple Regression
www2.stat.duke.eduestimates (recall the correlation is the covariance divided by the product of the standard deviations, so the covariance is the correlation times the product of the standard deviations. Since the standard deviations are unknown, we use the estimated covariance matrix calculated using the standard errors. In the Results options for Regression, check