
Correlation and Regression
Notes prepared by Pamela Peterson Drake 1 Correlation and Regression Basic terms and concepts 1. A scatter plot is a graphical representation of the relation between two or more variables. In the scatter plot of two variables x and y, each point on the plot is an x-y pair.
Download Correlation and Regression

Information
Domain:
Source:
Link to this page:
Documents from same domain

Financial Ratio Analysis - educ.jmu.edu
educ.jmu.eduFinancial ratio analysis A reading prepared by Pamela Peterson Drake O U T L I N E 1. Introduction 2. Liquidity ratios 3. Profitability ratios and activity ratios

Advantage and disadvantages of the different …
educ.jmu.eduProfitability Index Advantages Disadvantages 1. Tells whether an investment increases the firm's value 2. Considers all cash flows of the project

Solutions to Time Value of Money Practice Problems
educ.jmu.eduSolutions to Time value of money practice problems Prepared by Pamela Peterson Drake 1. What is the balance in an account at the end of 10 years if …
Financial Ratio Formulas - educ.jmu.edu
educ.jmu.eduFinancial ratio formulas Prepared by Pamela Peterson Drake 1. Operating cycle Inventory Inventory Number of days of inventory Average day's cost of …

Financial ratio analysis - educ.jmu.edu
educ.jmu.eduBesides financial statement data, market data, and economic data, in financial analysis you also need
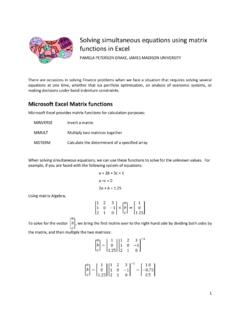
Solving simultaneous equations using matrix …
educ.jmu.edu3 Step 3: Multiply matrices You multiply matrices using the MMULTI function, selecting the cells that you want the results (in this example, cells B12, B13 and B14:

Residual income - educ.jmu.edu
educ.jmu.edu1 Residual income A reading prepared by Pamela Peterson Drake James Madison University WHAT IS RESIDUAL INCOME? Analysts can choose from a number of methods to value a company’s equity, including the discounted dividend and
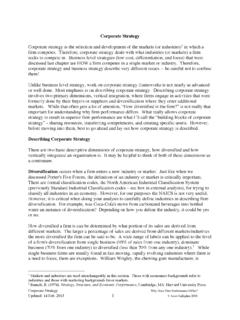
Corporate Strategy - educ.jmu.edu
educ.jmu.eduCorporate strategy is the selection and development of the markets (or industries)1 in which a firm competes. Therefore, corporate strategy deals with what industries (or markets) a firm seeks to compete in. Business level strategies (low cost, differentiation, and focus) that were
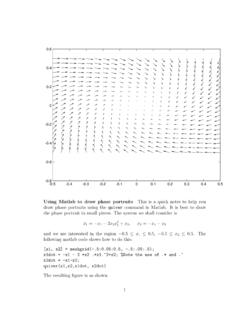
quiver - educ.jmu.edu
educ.jmu.eduUsing Matlab to draw phase portraits This is a quick notes to help you draw phase portraits using the quiver command in Matlab. It is best to draw the phase portrait in …
What is free cash flow and how do I calculate it?
educ.jmu.eduA key cash flow in both analysis and valuation is the cash flow for/from operating activities. This cash flow is calculated by adjusting net income for non-cash expenses and income, as well as for changes in working capital accounts. This
Related documents

EC 823: Applied Econometrics - fmwww.bc.edu
fmwww.bc.eduThe mean of the lagged dependent variable contains observations 0 through (T 1) on y, and the mean error—which is being conceptually subtracted from each it —contains contemporaneous values of for ... all of which may be correlated with ui, the unobserved individual effect. First-differencing the equation removes

Understanding the Dependent t Test
oak.ucc.nau.edusubjects, simple repeated-measures or within-groups, or correlated groups) assesses whether the mean difference between paired/matched observations is significantly different from zero. That is, the dependent-samples t test procedure evaluates whether there is a significant difference between the means of the two variables (test occasions or ...

Econometrics - Department of Economics
economics.harvard.edubecomes uncorrelated with u, but W can be correlated with u. ... SER implies that the spread of the observations around the regression is large, and there could be other important factors that we have not included in the regression. 8. Hypothesis Testing

CPT AND SPT BASED LIQUEFACTION TRIGGERING PROCEDURES
faculty.engineering.ucdavis.eduprocedures began with work by Zhou (1980) using observations from the 1978 Tangshan earthquake and was followed by Seed and Idriss (1981) and Douglas et al. (1981) who proposed the use of correlations between SPT and CPT penetration resistances to convert the then available SPT-based liquefaction triggering charts for use with the CPT.

Learner Readiness Why and How Should They Be Ready?
files.eric.ed.govThere are other significant facts and observations that should be ... studies may vary and prove that some strategies work better or are negatively correlated than others while others may present similar or contradictory results of the same strategies when employed by learners of varied competency. However, almost all of them agreed that there
ECONOMETRICS
www.ssc.wisc.edu1. 2. Econometrics Econometrics. Econometrics