
Creating Charts and Graphs
Figure 2. Using the Insert Chart button Using the Chart AutoPilot Once Insert Chart is selected, the chart AutoPilot menu appears. (See Figure 3.) The first dialog is used to define the data range, the labels, and the target sheet for the chart. Figure 3. Create a Chart AutoPilot Data Range The data range selected should contain both the labels ...
Download Creating Charts and Graphs

Information
Domain:
Source:
Link to this page:
Documents from same domain
Introduction aux macros et au Basic - Apache …
www.openoffice.orgFormation express / Introduction aux macros et au Basic Présentation Ce manuel vous donne des informations de base concernant les macros et son

Project-Management with Gantt-Charts
www.openoffice.orgProject-Management with Gantt-Charts OpenOffice.org 2.0 Calc [Projekt-Management und Gantt-Diagramm mit OpenOffice.org 2.0 Calc and Comment créer un diagramme de Gantt avec OpenOffice.org]
The Microsoft Excel File Format - Apache OpenOffice
www.openoffice.org1.2 Abstract 1.2 Abstract This document contains a description of the binary file format of Microsoft Excel, including all available Excel versions

How to Protect a Sheet or a Cell - Apache OpenOffice
www.openoffice.orgOpenOffice.org Documentation Project How-To 1. Protection of a Sheet To write-protect all of the cells of a sheet, you have to do the following: Select Tools-Protect Document from the Menu Bar,
The Microsoft Excel File Format - Apache OpenOffice
www.openoffice.org1.2 Abstract 1.2 Abstract This document contains a description of the binary file format of Microsoft Excel, including all available Excel versions
Troubleshooting Common Problems - Apache OpenOffice
www.openoffice.orgCommon.xcu might be a good place to look. Again, once the file is located, simply rename the file (for example to something like Common.xcu.old). Now restart OpenOffice.org and a new Common.xcu is created and the problem should have disappeared. Troubleshooting Common Problems 1

File Management in OpenOffice
www.openoffice.orgOpening files Opening files To open an existing document, choose File > Open or click the Open File icon on the Function Toolbar, or press Control+O. The Open dialog appears. Figure 1 shows the WindowsXP version of this dialog.
How to Create and Maintain a Table of Contents - Official Site
www.openoffice.org0.2 03/01/04 • Modified chapter “Maintaining a table of contents.” To ... The Insert/Index Table window has five tabs. Four of them are used when creating a table of contents: • Use the Index/Table tab to set the table's attributes.

OpenOffice.org Writer for Microsoft Word users
www.openoffice.orgContents Overview Experienced users of Microsoft Word may take awhile to discover how to do common tasks in OOoWriter, because some of the menus and the terminology are a bit different.

Comment Travailler Avec des Tableaux - openoffice.org
www.openoffice.orgComment Travailler Avec des Tableaux Diffusé Par Le Projet Documentation d'OpenOffice.org
Related documents
Creating Charts That Show Trends
ptgmedia.pearsoncmg.com“Using a Workaround to Display a Time-Scale Axis” for the rather complex steps needed to plot data by periods smaller than a day. Dates that you need to appear as text in order to draw in a decorative element— The case study, “Using a Decorative Element in a Chart,” later in this chapter, shows a
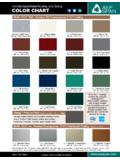
Architectural Metal Roofing and Siding COLOR CHART
www.aepspan.comcan display waviness commonly referred to as “oil canning”. “Oil canning” is an inherent characteristic of steel products, ... All information stated in the color chart is correct at time of printing and subject to change without notice, check our website for the latest version.

PERFORMANCE STANDARDS FOR ELECTRONIC CHART …
www.register-iri.comfollowing three categories, Display Base, Standard Display and All Other Information (see Appendix 2). 3.3 ECDIS should present the Standard Display at any time by a single operator action. 3.4 When a chart is first displayed on ECDIS, it should provide the Standard Display at the largest scale available in the SENC for the displayed area.

RESOLUTION MSC.232(82) (adopted on 5 December 2006 ...
wwwcdn.imo.org3.4 Standard Display is the display mode intended to be used as a minimum during route planning and route monitoring. The chart content is listed in appendix 2. 3.5 Display Base means the chart content as listed in appendix 2 and which cannot be removed from the display. It is not intended to be sufficient for safe navigation.
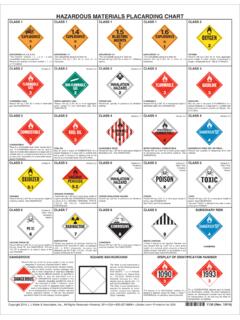
HAZARDOUS MATERIALS PLACARDING CHART
www.jjktrainingportal.comHAZARDOUS MATERIALS PLACARDING CHART CLASS 2 Division 2.1 FLAMMABLE GAS Placard 454 kg (1,001 lb) or more of flammable gas. See DANGEROUS. CLASS 2 Division 2.2 NON-FLAMMABLE GAS Placard 454 kg (1,001 lb) or more aggregate gross weight of non-flammable gas. See DANGEROUS. CLASS 2 Division 2.3 POISON GAS Placard any quantity …

Wilson Reading System - Scope & Sequence Chart
p13cdn4static.sharpschool.comWilson Reading System - Scope & Sequence Chart Listed are projected grade levels for Introduction, Application, and Mastery. It is assumed that each grade level would begin the school year assessing skills with expected mastery from the preceding year(s), and review where needed before moving on to new skills.
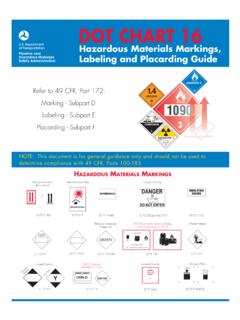
DOT CHART 16 Hazardous Materials Markings,Labeling and ...
www.phmsa.dot.govprescribed in 29 CFR 1910.1030(g). A bulk package of RMW must display a BIOHAZARD marking. §172.323, §172.405(c), §172.429, §172.430, §172.432 §172.450 §172.448 or §172.411 NEW Effective January 2019, the NEW Class 9 lithium battery handling label must be used for lithium battery shipments. final interior reprint.indd 1 11/16/2017 3:02 ...
Early Warning Signs of Autism Spectrum Disorder
www.cdc.govChildren who have severe language deficits and/or display the symptoms of hand flapping or toe walking are more likely to be diagnosed earlier. Introduce the session goal and format of the case study Slide 1-2 Cultural Competence It is important for clinicians to understand how different childrearing practices and cultural

Weather & UV Chart: A SunSmart resource for childcare ...
www.cancercouncil.com.auThe Weather & UV Chart should be set up on a stand or on the floor for all children to be able to reach the chart and have a clear view. Set the chart up with all magnets in their place and check the day’s maximum UV level. Find the UV level on the free SunSmart app, at

Nikonians Teleconverter Compatibility Table
www.nikonians.orgViewfinder Display and EXIF Data D (a): The camera display and EXIF generally show the adjusted aperture and focal length, e.g. with a 1.4x converter on a 200mm lens set to f/4, the camera will show 280mm and f/5.6. D (b): The camera display and EXIF generally show the aperture and focal length of the lens itself,