
Data-Based Individualization - Intensive Intervention
2 Data-Based Individualization: A Framework for Intensive Intervention In terms of multi-tiered intervention frameworks, students with disabilities and other students referred for intensive intervention have been insufficiently responsive to the core instruction afforded all students (Agodini et al., 2009) and have also responded inadequately to
Download Data-Based Individualization - Intensive Intervention

Information
Domain:
Source:
Link to this page:
Documents from same domain
Worksheet Fraction Equivalence - Intensive Intervention
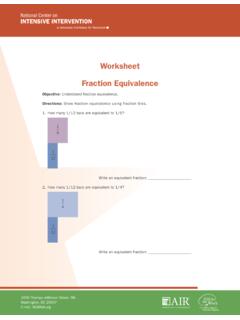
intensiveintervention.orgStudent Worksheet: Fraction Equivalence. 3. How many 1/10 bars are equivalent to 1/5? Write an equivalent fraction: _____ 4. How many 1/12 bars are equivalent to 1/2? ... 3. Compare the fractions using the greater than (>), less than (<), or equal to (=) symbol. 4. Check your work with the fraction tiles. a. If your answer is correct, draw a ...

Hide and Seek - Intensive Intervention
intensiveintervention.orgNational Center on Intensive Intervention Hide and Seek—1 8593_02/17 Hide and Seek Adapted with permission from The University of Texas Center for Reading and Language Arts.
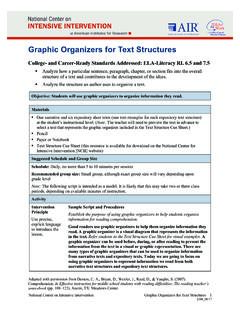
Graphic Organizers for Text Structures
intensiveintervention.orgof a graphic organizer for that text structure type. Earlier I told you that we could use different graphic organizers to represent the information from the text.

Identifying Narrative and Expository Text Structures
intensiveintervention.orgNational Center on Intensive Intervention Identifying Narrative and Expository Text Structures—5 Text Structure Cue Sheet This handout should serve as a guide for students as they learn about text …

Phonemic Awareness: Phoneme Segmentation
intensiveintervention.orgwords, syllables, and sounds (phonemes). Blend and segment onsets and rimes of single-syllable spoken words Objective: Students will learn to segment words into individual phonemes (sounds). Materials OPTIONAL: Manipulatives, such as blocks, magnetic letters, Elkonin boxes (see page 4), practice word lists (see supplemental materials).

Point Sheets/Behavior Report Cards - Intensive Intervention
intensiveintervention.orgNational Center on Intensive Intervention Point Sheets—3 . Point Sheets/Behavior Report Cards . Purpose and Overview: Students earn points throughout the day that can later be redeemed for access to preferred reinforcers or activities. When implementing any system, a teacher needs to be clear about the

Place-Value Concepts - Intensive Intervention
intensiveintervention.orgStandard notation: Writing a number with one digit in each place value 42,103. Place: The position of a digit relative to the decimal Ones, tens, hundreds, etc. Expanded notation: Writing a number and showing the place value of each digit 40,000 + 2,000 + 100 + 3 . 2
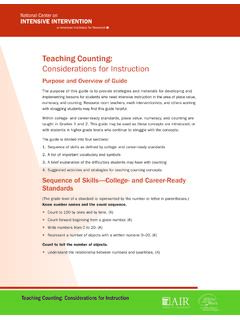
Teaching Counting - Intensive Intervention
intensiveintervention.org¡ Compare two numbers between 1 and 10 presented as written numerals. (K) Extend the counting sequence. ¡ Count to 120, starting at any number. (1) ¡ Read and write numerals (to 12), and represent a number of objects with a written numeral. (1) ¡ Count within 1,000. (2) ¡ Skip count by 5s, 10s, and 100s. (2) Add and subtract within 20.

User Guide for Sample Reading Lessons - Intensive Intervention
intensiveintervention.orgstruggling students (Gersten et al., 2008; National Reading Panel, 2000). In an explicit instruction lesson, teachers provide modeling, scaffolding, and prompting until students are able to apply a skill independently (Archer & Hughes, 2011). Although there are no speciic guidelines concerning how much time should be

Identifying Narrative Text Structures - Intensive Intervention
intensiveintervention.orgof the text; provide an objective summary of the text. Analyze how a particular sentence, paragraph, chapter, or section fits into the overall structure of a text and contributes to the development of the ideas. Objective: Students will learn …
Related documents
Narrative Visualization: Telling Stories with Data
vis.stanford.eduNarrative Visualization: Telling Stories with Data Edward Segel and Jeffrey Heer Abstract—Data visualization is regularly promoted for its ability to reveal stories within data, yet these “data stories” differ in important ways from traditional forms of storytelling. Storytellers, especially online journalists, have increasingly been integrating visualizations
Self-Efficacy Assessment Suite Technical Report
www.researchcollaboration.orggraph of students’ scores on each component and self-efficacy overall, which is followed by a breakdown of student responses. The last section provides students’ responses to the essay question: ... data-driven decision-making to increase their students’ abilities to focus on their effort, progress, and learning . Erickson

Table of ConTenTs
nces.ed.govThe most important part of your graph is the information, or data, it contains. Bar graphs can present data in many ways and can present more than one group of data at a time. The graph on the left is a regular bar graph with one group of data. The center graph has two groups of data that are stacked.

Power of the Pyramids - Population Education
populationeducation.orgStudents should complete these calculations for each cohort. 3. Model how to construct a population pyramid. You may want to project a blank sheet of Pyramid Graph Paper with a data sheet on the board using a document camera or Smartboard. 4. Students construct a population pyramid for their assigned country by graphing the percentage data onto the

ATLAS-Looking at Data Protocol - The To&Through Project
toandthrough.uchicago.eduLooking at Data Learning from Data is a tool to guide groups of teachers discovering what students, educators, and the public understand and how they are thinking. The tool, developed by Eric Buchovecky, is based in part on the work of the Leadership for Urban Mathematics Project and the Assessment Communities of Teachers Project.
LEARNWELL OY
www.ilc.cuhk.edu.hkCircle and highlight the graph. Use arrows. Make notes. Circle the biggest, the smallest. stable or unchanging parts, sudden increases, etc. Identify trends. A trend is the overall idea of the graph • what is happening/what happened • the main change over time • the most noticeable thing about the graph • the pattern over time
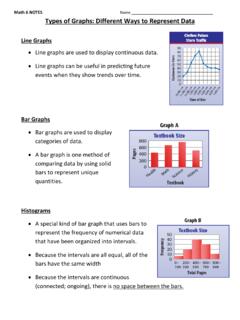
Math 6 NOTES Name Types of Graphs: Different Ways to ...
www.lcps.orgMake a bar graph of the data. Compare the number of students in jazz class with the number in ballet class. Step 1 Decide on the scale and interval. Step 2 Label the horizontal and vertical axes. Step 3 Draw bars for each style. Step 4 Label the graph with a title. About twice as many students take ballet as take jazz. Make a line graph of the ...