
Digital Image Processing
An expanded explanation of spatial correlation and convolution. ... material is an intuitive derivation of the sampling theorem and its implica-tions.The 1-D material is then extended to 2-D,where we give a number of ex-amples to illustrate the effects of sampling on digital images,including aliasing
Download Digital Image Processing

Information
Domain:
Source:
Link to this page:
Documents from same domain

AN INTRODUCTION TO MACHINE LEARNING
web.ipac.caltech.eduMachine Learning 6 Introduction: Explanation & Prediction FOR ANY PARTICULAR ANALYSIS CONDUCTED, emphasis can be placed on understanding the underlying mechanisms which have spe-cific theoretical underpinnings, versus a focus that dwells more on

A lternatives to the M e d ia n A bsolute D eviation
web.ipac.caltech.eduA lternatives to the M e d ia n A bsolute D eviation P eter J. R ouss~ ~ uwa n d C h risto p h e C ~ o u x * In ro b u st estim atio n o n e frequently needs an initial o r auxiliary estim ate of scale.

Measures of Shape: Skewness and Kurtosis
web.ipac.caltech.edubut their shapes are different. Beta(α=4.5, β=2) skewness = −0.5370 1.3846 − Beta(α=4.5, β=2) skewness = +0.5370 The first one is moderately skewed left: the left tail is longer and most of the distribution is at the right. By contrast, the second distribution is moderately

Line Detection by Hough transformation
web.ipac.caltech.edu5. If the bin with the largest value in the accumulator (BINX) that was modified is lower than the threshold, goto point 1. 6. Search in IMG1 along a corridor specified by BINX, and find the longest segment of pixels either continuous or exhibiting gaps not exceeding a given threshold. 7. Remove the pixels in the segment from IMG2. 8. Clear ...
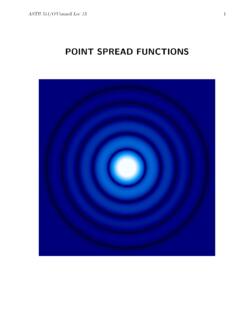
POINT SPREAD FUNCTIONS - California Institute of Technology
web.ipac.caltech.edu(Tiny Tim simulation) ASTR 511/O’Connell Lec 13 9 Azimuthally averaged profile of WFPC2-PC PSF. ASTR 511/O’Connell Lec 13 10 Encircled energy for the WFPC2-PC PSF. The 70% EE radius is 2 pixels or 0.09200. Created Date:
The Fourier Transform - California Institute of Technology
web.ipac.caltech.eduThe Fourier Transform The Fourier transform is crucial to any discussion of time series analysis, and this chapter discusses the definition of the transform and begins introducing some of the ways it is useful. We will use a Mathematica-esque notation. This includes using the symbol I for the square root of minus one.
Related documents

B.A. (HONOURS) ECONOMICS
www.du.ac.in2 University of Delhi Course: B.A. (Hons.) Economics Semester I Paper 01 – Introductory Microeconomics Paper 02- Statistical Methods in Economics-I Paper 03 - Mathematical Methods for Economics-I Paper 04 - Concurrent – Qualifying Language

Probability Theory: The Logic of Science
bayes.wustl.eduAn Interesting Correlation 279 Historical Background 280 How to Cheat at Coin and Die Tossing 281 Bridge Hands 285 General Random Experiments 287 Induction Revisited 289 But What About Quantum Theory? 290 Mechanics Under the Clouds 292 More On Coins and Symmetry 293 Independence of Tosses 297 The Arrogance of the Uninformed 300

Covariance, Regression, and Correlation
nitro.biosci.arizona.eduthe correlation between characters, and measures of selection. As a prelude to the formal theory of covariance and regression, we first pro- ... Derivation of the Least-Squares Linear Regression The mathematical method of least-squares linear regression provides one such
Chapter utorial: The Kalman Filter
web.mit.eduy that his solution uses b oth the auto correlation and the cross correlation of the receiv ed signal with the original data, in order to deriv e an impulse resp onse for the lter. Kalman also presen ted a prescription of the optimal MSE lter. Ho w ev er Kalman's has some adv an tages o v er W einer's; it sidesteps the need to determine impulse ...

Lectures on Quantum Gravity and Black Holes
www.hartmanhep.netextremal black holes. The nal third of the course is on AdS/CFT, including correlation functions, black hole thermodynamics, and entanglement entropy. The emphasis is on semiclassical gravity, so topics like string theory, D-branes, and super-Yang Mills are discussed only very brie y. Course Cornell Physics 7661, Spring 2015
Factor Analysis - Harvard University
cdn1.sph.harvard.edue.g. squared correlation between a variable and the remaining variables b) Solve objective function: det(R LS-ηI)=0, where R LS is the corr matrix with h2 in the main diag. (also termed adjusted corr matrix), η is an eigenvalue c) Re-estimate h2 d) Repeat b) and c) until no improvement can be made 18

CHEMISTRY (862)
cisce.org(v) Nernst equation and correlation with the free energy of the reaction with suitable examples. Prediction of spontaneity of a reaction based on the cell emf. Numericals on standard electrode poential t of half-cells, cell emf, relationship between free energy and equilibrium constant, standard electrode potential and free energy.

Banking Profitability and Performance Management
www.pwc.inAnalysing the Pearson‟s correlation coefficient for banks operating in India, across the years 2005 – 2010, reveals a very low correlation between balance sheet size and ROA distribution. Chart 2: Correlation co-efficient between ROA and balance sheet size 2005-06 2006-07 2007-08 2008-09 2009-10 0.088 -0.019 -0.013 0.002 0.038

OLS in Matrix Form - Stanford University
www.web.stanford.eduhas zero sample correlation with the residuals. Note that this does not mean that X is un-correlated with the disturbances; we’ll have to assume this. If our regression includes a constant, then the following properties also hold. 2. The sum of the residuals is zero. If there is a constant, then the flrst column in X (i.e. X. 1
Interpretation in Multiple Regression
www2.stat.duke.eduCorrelation of Coefficients: (Intercept) log.duration log.duration -0.9579857 ---- I 0.2361514 -0.3860614 The correlation between something and itself is one, so this part has been omitted. Since the correlation of (b0, b1) is the same as the correlation of ( b1, b0) the table only includes the elements below the diagonal.