DISCRIMINANT FUNCTION ANALYSIS (DA)
DISCRIMINANT FUNCTION ANALYSIS (DA) John Poulsen and Aaron French Key words: assumptions, further reading, computations, standardized coefficents, structure matrix, tests of signficance Introduction Discriminant function analysis is used to determine which continuous variables
Download DISCRIMINANT FUNCTION ANALYSIS (DA)

Information
Domain:
Source:
Link to this page:
Documents from same domain
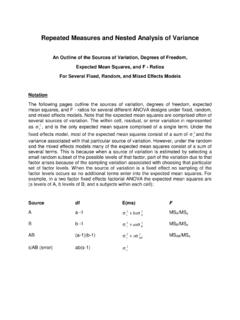
Repeated Measures and Nested Analysis of Variance
userwww.sfsu.edubecause of the sampling variation associated with choosing a subset of factor levels. Therefore, one must contrive a combination of mean squares that will isolate the source

Profile Analysis - San Francisco State University
userwww.sfsu.eduProfile Analysis . Introduction . Profile analysis is the multivariate equivalent of repeated measures or mixed ANOVA. Profile analysis is …

Log Linear Models - San Francisco State University
userwww.sfsu.eduThe following model refers to the traditional chi-square test where two variables, each with two levels (2 x 2 table), are evaluated to see if an association exists between the
Probit Analysis By: Kim Vincent - San Francisco …
userwww.sfsu.eduProbit Analysis is commonly used in toxicology to determine the relative toxicity of chemicals to living organisms. This is done by testing the response of …

Electric Circuits Fundamentals - userwww.sfsu.edu
userwww.sfsu.eduElectric Circuits Fundamentals Sergio Franco, San Francisco State University Oxford University Press, 1995 ISBN: 0-19-513613-6 . basis.

TEAM - Marketing Plan (Sample)
userwww.sfsu.eduConfidential For Internal Use Only Team 8 3 theme park. Six Flags can also try to sell some of its land that it owns surrounding its parks to

Statistical Power Analysis - San Francisco State University
userwww.sfsu.eduhypothesis and "non-central" is used to describe the distribution of a test statistic under a specific alternative hypothesis. Figure 2 shows the distribution of t under the null and alternative hypothesis.
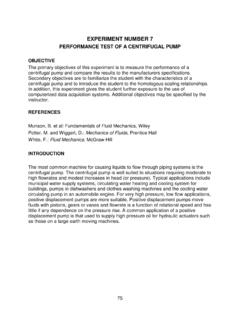
PERFORMANCE TEST OF A CENTRIFUGAL PUMP
userwww.sfsu.educentrifugal pump and compare the results to the manufacturers specifications. Secondary objectives are to familiarize the student with the characteristics of a centrifugal pump and to introduce the student to the homologous scaling relationships.

A SURVEY OF PHYSICAL PRINCIPLES ATTEMPTING TO DEFINE ...
userwww.sfsu.eduA SURVEY OF PHYSICAL PRINCIPLES ATTEMPTING TO DEFINE QUANTUM MECHANICS GARY OAS AND J. ACACIO DE BARROS Abstract. Quantum mechanics, one of the most successful theories in the

“I Just Wanna Be Average'
userwww.sfsu.edu“I Just Wanna Be Average" MIKE ROSE Mike Rose is anything but average: he has published poetry, scholarly research, a textbook, and two widely praised books on education in America. A professor in the School of Education at UCLA, Rose has won awards from the National Academy of Education, the National Council of Teachers of English,
Related documents

Power and Sample Size - www.bristol.ac.uk | …
www.bristol.ac.ukDefinition • Power is the probability of detecting an effect, given that the effect is really there • Or likewise, the probability of rejecting the null hypothesis when

Hypothesis Testing with SPSS - DrJimMirabella.com
www.drjimmirabella.com12/30/2006 3 © 2006 Capella University -Confidential -Do not distribute 13 DEMO of the Most Common Hypothesis Tests o Now let’s conduct the common hypothesis tests ...
The Implications of Parametric and Non-Parametric ...
www.ijhssnet.comInternational Journal of Humanities and Social Science Vol. 5, No. 6; June 2015 74 The Implications of Parametric and Non-Parametric Statistics in Data Analysis in

Principles of Econometrics, 4 Edition
www.principlesofeconometrics.comChapter 3 Interval Estimation and Hypothesis Testing Learning Objectives Keywords 3.1 Interval Estimation 3.1.1 The t‐distribution 3.1.2 Obtaining Interval Estimates

Introduction to Building a Linear Regression Model
www2.sas.comIntroduction to Building a Linear Regression Model Leslie A. Christensen The Goodyear Tire & Rubber Company, Akron Ohio Abstract This paper will explain the steps necessary to build

t-Test Statistics
www.ohio.edu1 t-Test Statistics Overview of Statistical Tests Assumption: Testing for Normality The Student’s t-distribution Inference about one mean (one sample t-test) Inference about two means (two sample t-test) Assumption: F-test for Variance Student’s t-test - For homogeneous variances