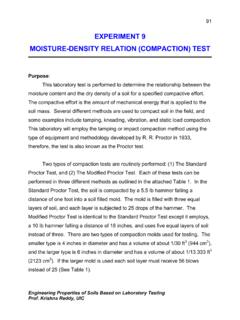
EXPERIMENT 9 MOISTURE-DENSITY RELATION …
Oct 05, 2002 · density in grams per cm3. (4) Plot the dry density values on the y-axis and the moisture contents on the x-axis. Draw a smooth curve connecting the plotted points. (5) On the same graph draw a curve of complete saturation or “zero air voids curve”. The values of dry density and corresponding moisture
Download EXPERIMENT 9 MOISTURE-DENSITY RELATION …

Information
Domain:
Source:
Link to this page:
Documents from same domain

EXPERIMENT 10
cemmlab.webhost.uic.eduOct 10, 2002 · Enough water should be added so that the mixture may flow freely (see Photo B). (5) Using a scoop, pour the prepared soil into the lower chamber using a circular motion to fill it to a depth of 1.5 cm. A uniform layer should be formed. (6) Use the tamping device to compact the layer of soil. Use

EXPERIMENT 12 UNCONFINED COMPRESSION (UC) TEST
cemmlab.webhost.uic.eduAug 30, 2002 · the shear plane; and s‘ = (s - u), s = total pressure, and u = pore water pressure; c’ and ϕ’ are drained shear strength parameters. The determination of drained shear strength parameters is given in Experiment 14 Equipment: Compression device, Load and deformation dial gauges, Sample trimming equipment, Balance, Moisture can.

Direct Shear Test - University of Illinois at Chicago
cemmlab.webhost.uic.eduAug 30, 2002 · The direct shear test is one of the oldest strength tests for soils. In this laboratory, a direct shear device will be used to determine the shear strength of a cohesionless soil (i.e. angle of internal friction (f)). From the plot of the shear stress versus the horizontal displacement, the maximum shear stress is obtained for a

EXPERIMENT 7 ATTERBERG LIMITS
cemmlab.webhost.uic.eduSep 20, 2002 · dimensions will flow together at the base of the groove for a distance of 13 mm (1/2 in.) when subjected to 25 shocks from the cup being dropped 10 mm in a standard liquid limit apparatus operated at a rate of two shocks per second. The plastic limit (PL) is the water content, in percent, at which a soil can no longer be deformed by
Related documents
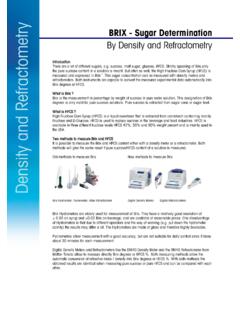
BRIX - Sugar Determination By Density and Refractometry ...
beta-static.fishersci.comThe density is the quotient of the mass m and the volume V of a substance (mass density). As the density depends primarily on the temperature, the latter must always be specified. d = m/V [kg/m3] or [g/cm3] More information can be found at: www.density.com .
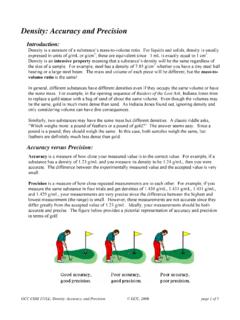
Density: Accuracy and Precision
web.gccaz.eduDensity is a measure of a substance’s mass-to-volume ratio. For liquids and solids, density is usually expressed in units of g/mL or g/cm3; these are equivalent since 1 mL is exactly equal to 1 cm3. Density is an intensive property meaning that a …

258 616 Bulk Density and Tapped Density of Powders ...
www.drugfuture.comthe tapped density (g/mL) using the formula M F/100 where performance liquid chromatography). M F is the mass of powder in the measuring vessel. Record the average of three determinations using three different powder samples. The test conditions including tapping GENERAL PROCEDURES height are specified in the expression of the results.

STITCH DENSITY GUIDE - Madeira USA
www.madeirausa.comSTITCH DENSITY GUIDE Due to the different thread types and thicknesses, the stitch density needs to be adjusted when digitizing. In some cases, different embroidery needles are needed. The following chart shows the stitch density and the appropriate needle sizes that are suitable for each embroidery thread.

Mass, Volume, & Density - Tumwater School District
www.tumwater.k12.wa.usDensity is defined as mass per unit volume. It is a measure of how tightly packed and how heavy the molecules are in an object. Density is the amount of matter within a certain volume.
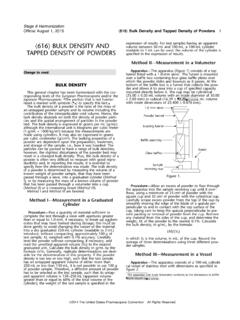
BULK DENSITY AND TAPPED DENSITY OF POWDERS
www.usp.orgTAPPED DENSITY V 1250 is the tapped volume. If the difference between V 500 and V 1250 exceeds 2mL, repeat in increments such as 1250 taps, until the difference between succeeding measure-The tapped density is an increased bulk density attainedments is less than or equal to 2mL. Fewer taps may be
S.3.6. BULK DENSITY AND TAPPED DENSITY OF POWDERS …
www.who.intTAPPED DENSITY The tapped density is an increased bulk density attained after mechanically tapping a container containing the powder sample. The tapped density is obtained by mechanically tapping a graduated measuring cylinder or vessel containing the powder sample. After observing the initial powder volume or mass, the