
Getting Started in Data Analysis using Stata
Do-files (doedit) Opening/saving a Stata datafile Quick way of finding variables Subsetting (using conditional “if”) Stata color coding system From SPSS/SAS to Stata Example of a dataset in Excel From Excel to Stata (copy-and-paste, *.csv) Describe and …
Download Getting Started in Data Analysis using Stata

Information
Domain:
Source:
Link to this page:
Documents from same domain
Introduction to RStudio
dss.princeton.eduThe console is where you can type commands and see output The workspace tab shows all the active objects (see next slide). The history tab shows a list of commands used so far. The files tab shows all the files and folders in your default workspace as if you were on

Multiple Imputation of Missing Data Using Stata
dss.princeton.eduimputation model should always include all the variables in the analysis model, including the dependent variable of the analytic model as well as any other variables that may provide information about the probability of missigness, or about the true value of the missing data. Theory should guide the decision as to which variables to include.

Panel Data Analysis Fixed and Random Effects using Stata ...
dss.princeton.eduPU/DSS/OTR Fixed Effects using least squares dummy variable model (LSDV). 16 _cons 8.81e+08 9.62e+08 0.92 0.363 -1.04e+09 2.80e+09

Linear Regression using Stata - Princeton University
dss.princeton.edubetween X and Y. R-square shows the amount of variance of Y explained by X. In this case expenseexplains 22% of the variance in SAT scores. Lets run the regression: regress . csat expense, robust. Adj R. 2 (not shown here) shows the same as . R. 2. but adjusted by the # of cases and # of variables. When the # of variables is small and the # of ...

Data Preparation/Descriptive Statistics
dss.princeton.eduextensions are *.txt for tab-separated data and *.prn for space-separated data. Any statistical package can read these formats. •Record form (or fixed). Data is structured by fixed blocks (for example, var1 in columns 1 to 5, var2 in column 6 to 8, etc). You will need a codebook and to write a program (either in Stata, SPSS or SAS) to read ...
Notes on Exploring Data - Princeton University
dss.princeton.eduSPSS . SAS . Stata . JMP (SAS) R . Python (Pandas) Learning curve Gradual . Pretty steep Gradual . Gradual . Pretty steep Steep . User interface Point-and-click . Programming . Programming/ point-and-click . Point-and-click . Programming Programming Data manipulation Strong . Very strong Strong .
Related documents
R Data Import/Export
cran.r-project.orgworld they almost always are for UCS-2/UTF-16 files, and often are for UTF-8 files. Thefile utility will not even recognize UCS-2 files without a BOM, but many other utilities will refuse to read files with a BOM and theIANA standards for UTF-16LE and UTF-16BE prohibit it. We
Data Analysis using SPSS - University of North Dakota
med.und.eduStarting in SPSS: Looking at data Seeing what data looks like is the first step to data analysis It gives a broad-overview in what is going on Again, each row is a different sample, while the columns show the value of different variables for that sample Looking at the data tells you a lot of big-picture things
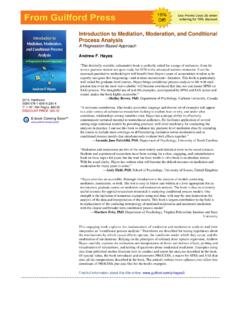
Introduction to Mediation, Moderation, and Conditional ...
dm.darden.virginia.edudata from published studies illustrate how to conduct and report the analyses described in the book. Of special value, the book introduces and documents PROCESS, a macro for SPSS and SAS that does all the computations described in the book. The author's website (www.afhayes.com) offers free downloads of PROCESS plus data files for the book's ...
STATISTICS WITH R PROGRAMMING Lecture Notes
gvpcew.ac.in• R is a powerful platform for interactive data analysis and exploration. • Getting data into a usable form from multiple sources . • R functionality can be integrated into applications written in other languages, including C++, Java, Python , PHP, SAS and SPSS. • R runs on a wide array of platforms, including Windows, Unix and Mac OS X.
Exploring Data and Descriptive Statistics (using R)
www.princeton.eduFeatures Stata SPSS SAS R Data extensions *.dta ... NOTE: As an alternative, you can use SAS Universal Viewer (freeware from SAS) to read SAS files and save them as *.csv. Saving the file as *.csv removes variable/value labels, make sure you have the codebook available. OTR 16. Data from ACII Record form ...
Using Logistic Regression: A Case Study
www.craftonhills.eduAdvantages of Using Logistic Regression Logistic regression models are used to predict dichotomous outcomes (e.g.: success/non-success) Many of our dependent variables of interest are well suited for dichotomous analysis Logistic regression is standard in packages like SAS, STATA, R, and SPSS
Data Preparation/Descriptive Statistics
dss.princeton.eduextensions are *.txt for tab-separated data and *.prn for space-separated data. Any statistical package can read these formats. •Record form (or fixed). Data is structured by fixed blocks (for example, var1 in columns 1 to 5, var2 in column 6 to 8, etc). You will need a codebook and to write a program (either in Stata, SPSS or SAS) to read ...

Understanding and Using the American Community Survey ...
www.census.govTIP: While PUMS data allow for more detailed and com - plex research techniques, the files are more difficult to work with than published tables. Data users need to use statistical software, such as SPSS, SAS, R, or Stata, to process PUMS data, and the responsibility for produc-ing estimates from PUMS and judging their statistical