
Getting Started in Data Analysis using Stata
From SPSS/SAS to Stata Example of a dataset in Excel From Excel to Stata (copy-and-paste, *.csv) Describe and summarize Rename Variable labels Adding value labels Creating new variables (generate) Creating new variables from other variables (generate) Recoding variables (recode) Recoding variables using egen
Download Getting Started in Data Analysis using Stata

Information
Domain:
Source:
Link to this page:
Documents from same domain
Introduction to RStudio
dss.princeton.eduThe console is where you can type commands and see output The workspace tab shows all the active objects (see next slide). The history tab shows a list of commands used so far. The files tab shows all the files and folders in your default workspace as if you were on

Multiple Imputation of Missing Data Using Stata
dss.princeton.eduimputation model should always include all the variables in the analysis model, including the dependent variable of the analytic model as well as any other variables that may provide information about the probability of missigness, or about the true value of the missing data. Theory should guide the decision as to which variables to include.

Panel Data Analysis Fixed and Random Effects using Stata ...
dss.princeton.eduPU/DSS/OTR Fixed Effects using least squares dummy variable model (LSDV). 16 _cons 8.81e+08 9.62e+08 0.92 0.363 -1.04e+09 2.80e+09

Linear Regression using Stata - Princeton University
dss.princeton.edubetween X and Y. R-square shows the amount of variance of Y explained by X. In this case expenseexplains 22% of the variance in SAT scores. Lets run the regression: regress . csat expense, robust. Adj R. 2 (not shown here) shows the same as . R. 2. but adjusted by the # of cases and # of variables. When the # of variables is small and the # of ...

Data Preparation/Descriptive Statistics
dss.princeton.eduextensions are *.txt for tab-separated data and *.prn for space-separated data. Any statistical package can read these formats. •Record form (or fixed). Data is structured by fixed blocks (for example, var1 in columns 1 to 5, var2 in column 6 to 8, etc). You will need a codebook and to write a program (either in Stata, SPSS or SAS) to read ...
Notes on Exploring Data - Princeton University
dss.princeton.eduSPSS . SAS . Stata . JMP (SAS) R . Python (Pandas) Learning curve Gradual . Pretty steep Gradual . Gradual . Pretty steep Steep . User interface Point-and-click . Programming . Programming/ point-and-click . Point-and-click . Programming Programming Data manipulation Strong . Very strong Strong .
Related documents
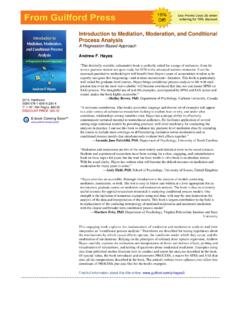
Introduction to Mediation, Moderation, and Conditional ...
dm.darden.virginia.edupassion that even the most 'stat-o-phobic' will become convinced that they too can master SPSS (or SAS) process. The thoughtful use of real-life examples, accompanied by SPSS and SAS syntax and output, makes the book highly accessible.” —Shelley Brown, PhD, Department of Psychology, Carleton University, Canada “A welcome contribution.

SPSS -alkeisopas
groups.jyu.fiSPSS mahdollisuuksia voidaan entisestään kasvattaa. SPSS on kenties yleisimmin Suomes-sa ja maailmanlaajuisestikin käytetty tilastollisen analyysin apuväline. Muita kansainväli-sesti käytettyjä tilasto-ohjelmistoja ovat muun muassa SAS ja Stata. Suomalaisia ohjel-

Testing mediation using bootstrapping in SPSS
www.socialchangelab.netSPSS and SAS procedures for estimating indirect effects in simple mediation models. Behavior Research Methods, Instruments, and Computers, 36, 717-731. Shrout, P. E., & Bolger, N. (2002). Mediation in experimental and nonexperimental studies: New ... This is the part of the syntax that tells SPSS to draw 5000 sample indirect effects (with ...
Longitudinal Data Analyses Using Linear Mixed Models in ...
downloads.hindawi.comSPSS. The general strategy for model building, testing, and comparison are described. Previous studies have illustrated the application of IGC using PROC MIXED in SAS[16,17,18], HLM[19], R[20], and SPSS[21]. Nevertheless, the longitudinal analysis reported in Peugh and Enders[21] was only a simple
Notes on Exploring Data - Princeton University
dss.princeton.eduSPSS . SAS . Stata . JMP (SAS) R . Python (Pandas) Learning curve Gradual . Pretty steep Gradual . Gradual . Pretty steep Steep . User interface Point-and-click . Programming . Programming/ point-and-click . Point-and-click . Programming Programming Data manipulation Strong . Very strong Strong .

A Primer for Analyzing Nested Data: Multilevel Modeling in ...
ies.ed.govStata and SAS allow analyses that account for statistical dependency in the estimation of standard errors. Likewise, the Advanced Statistics module of SPSS IBM Statistics uses multilevel modeling to analyze data with statistical dependency. Nested data: Multilevel
Structural Equation Modeling Using AMOS
stat.utexas.eduA Step-by-Step Approach to using the SAS System for Factor Analysis and Structural Equation Modeling. Cary, NC: SAS Institute, Inc. 1.4 Getting Help with AMOS If you have difficulties accessing AMOS on the STATS Windows terminal server, call the ITS helpdesk at 512-475-9400 or send e-mail to help@its.utexas.edu.