
Grade 8 Intermediate-level Science Test
9 The diagram below represents a pedigree chart. Which type of information is organized by this chart? (1) energy fl ow in an ecosystem (2) population growth for pea plants (3) the number of chromosomes in an organism (4) the passing of a trait from one generation to another . 10 A change in an animal’s DNA, leading to a
Download Grade 8 Intermediate-level Science Test

Information
Domain:
Source:
Link to this page:
Documents from same domain
GLOBAL HISTORY AND GEOGRAPHY - Regents …
www.nysedregents.orgThe University of the State of New York REGENTS HIGH SCHOOL EXAMINATION GLOBAL HISTORY AND GEOGRAPHY Wednesday, June 18, 2003 — 1:15 to 4:15 p.m., only Student Name_____ School Name _____
The University of the State of New York REGENTS …
www.nysedregents.orgThe University of the State of New York REGENTS HIGH SCHOOL EXAMINATION ALGEBRA I (Common Core) Tuesday, June 3, 2014 — 9:15 a.m. to 12:15 p.m., only Student Name:_____
GLOBAL HISTORY AND GEOGRAPHY - OSA : NYSED
www.nysedregents.orgThe University of the State of New York REGENTS HIGH SCHOOL EXAMINATION GLOBAL HISTORY AND GEOGRAPHY Tuesday, August 16, 2005 — 12:30 to 3:30 p.m., only Student Name _____ School Name _____
FOR TEACHERS ONLY - Regents Examinations
www.nysedregents.orgPart 1 Record the credit for Part 1: Speaking, as previously reported to the building principal. Part 2 Allow a total of 30 credits, two credits for each of the following:
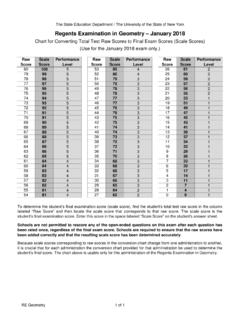
Regents Examination in Geometry – January 2018
www.nysedregents.orgThe State Education Department / The University of the State of New York Regents Examination in Geometry – January 2018 Chart for Converting Total Test Raw Scores to Final Exam Scores (Scale Scores)
FOR TEACHERS ONLY - NYSED
www.nysedregents.orgFOR TEACHERS ONLY The University of the State of New York REGENTS HIGH SCHOOL EXAMINATION LIVING ENVIRONMENT Thursday, August 17, 2017 — 12:30 to 3:30 p.m., only SCORING KEY AND RATING GUIDE

The University of the State of New York REGENTS …
www.nysedregents.orgThe University of the State of New York REGENTS HIGH SCHOOL EXAMINATION GEOMETRY (Common Core) Friday, June 16, 2017 — 9:15 a.m. to 12:15 p.m., only Student Name: School Name:
The University of the State of New York REGENTS …
www.nysedregents.orgThe University of the State of New York REGENTS HIGH SCHOOL EXAMINATION GEOMETRY Thursday, August 17, 2017 — 12:30 to 3:30 p.m., only Student Name: School Name: GEOMETRY DO NOT OPEN THIS EXAMINATION BOOKLET UNTIL THE SIGNAL IS GIVEN.
English Language Arts - NYSED
www.nysedregents.orgGo On Sample Test 2005 Book 1 Page 1 Directions In this part of the test, you are going to do some reading. Then you will answer questions about what you have read.
The University of the State of New York REGENTS …
www.nysedregents.orgdo not open this examination booklet until the signal is given. the university of the state of new york regents high school examination comprehensive examination
Related documents

Leology - Welcome
leology.weebly.comunlabeled pedigree by indicating the genotypes for all involved. What is the mode of inheritance for this pedigree? can be seen by 410ird genet-ahcn's If pa rent-s ear 'Cines _ con be c vp'aineci by parenf-s ;nheró+rd r-ecess;wely , me have —5 CIS 4_ Explain why you know the genotype of one female in the third generation, but are unsure of the
Exam Questions from Exam 1 – Basic Genetic Tests, Setting ...
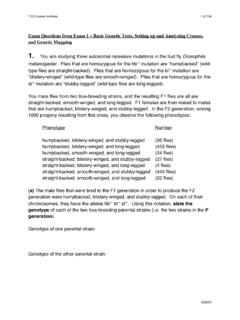
web.mit.edu(a) The male flies that were bred to the F1 generation in order to produce the F2 generation were humpbacked, blistery-winged, and stubby-legged. On each of their chromosomes, they have the alleles hb– bl– st–. Using this notation, state the genotype of each of the two true-breeding parental strains (i.e. the two strains in the P generation).