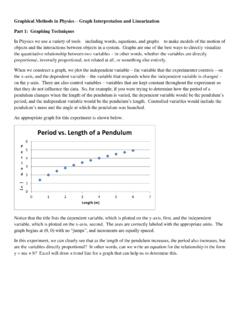
Graph Interpretation and Linearization
6. Click the chart area. Go to the drop-down menu under “Chart Tools”. Select “Trendline,” and “More Trendline Options” 7. Choose “Linear” if you believe your graph is linear. Otherwise, modify the data as needed and create a new linear graph.
Download Graph Interpretation and Linearization

Information
Domain:
Source:
Link to this page:
Documents from same domain

CHAPTER 6 Offer and Acceptance - wtps.org
www.wtps.orgLAW for Business and Personal Use © 2012 Cengage Learning. All Rights Reserved. May not be scanned, copied or duplicated, or posted to a publicly accessible website ...

CHAPTER 2 Constitutional Rights - wtps.org
www.wtps.orgLAW for Business and Personal Use © 2012 Cengage Learning. All Rights Reserved. May not be scanned, copied or duplicated, or posted to a publicly accessible website ...
Chapter 3 Review Materials Key
www.wtps.org6. The differential permeability of the plasma membrane to sodium (Na+) and potassium (K + ) ions results in the development of a voltage (resting membrane potential) of about —70 mV across the membrane as indicated in the simple diagram in Figure 3.5. First, draw in some Na+ and K + ions in the cytoplasm and extracellular fluid,

Computer Keyboard Practice Worksheets
www.wtps.orgKeyboard: Top Row How many “top row” keys can you remember? Fill in the blank keys with the alphabet letters! http://www.teacherspayteachers.com/Store/Fiona-Campbell

Non-Fiction Unit
www.wtps.orgNon-Fiction Unit Grade 4 5 weeks of lessons * Integrate unit with writing unit and use the non-fiction book(s) for the research paper to address many of these standards. * Additional Resources for exploring non-fiction (Story Works, National …

Should School Be Year-Round? - wtps.org
www.wtps.orgChoose the answer that best completes the sentence below. Students at a year-round school might get several weeks off at Thanksgiving _____ a year-round schedule includes mini-breaks throughout the year rather than one long summer break. A but B …
The Scholarship Jacket
www.wtps.orgCreated Date: 10/29/2009 8:59:31 AM

WASHINGTON TOWNSHIP PUBLIC SCHOOLS FIFTH GRADE …
www.wtps.orgthat Mrs. Hirsch's neighborhood shop has been closed. This event further alarms Mrs. Johansen, though Annemarie does not understand why. During a late night visit from Peter Neilsen, a member of the Resistance and the man Lise was to marry, Annemarie is told more about the war. Her parents and Peter explain that Jewish stores are being closed.
2.1 Transformations of Quadratic Functions
www.wtps.orgSection 2.1 Transformations of Quadratic Functions 51 Writing a Transformed Quadratic Function Let the graph of g be a translation 3 units right and 2 units up, followed by a refl ection in the y-axis of the graph of f(x) = x2 − 5x.Write a rule for g. SOLUTION Step 1 First write a function h that represents the translation of f. h(x) = f(x − 3) + 2 Subtract 3 from the input.
The truth behind 6 disturbing cyberbullying cases that ...
www.wtps.orgadvances in technology have now extended harassment to cell phones, social media websites and other online avenues that are contributing to an alarming number of cyberbullying cases leading to suicide. According to the Centers for Disease Control and Prevention (CDC), suicide is the third leading
Related documents
Calibration and Linear Regression Analysis: A Self-Guided ...
sites.chem.utoronto.caThe trendline should always be plotted and inspected visually. R2 is more discriminating in this respect, although it no longer indicates the slope of the regression line. This, however, is evident by inspection. o Any curvature in the data will result in erroneous conclusions about the correlation. R values are only applicable to linear ...

Experiment 5: Enzyme Kinetics - Kimberly Tierney's ...
ktierneyportfolio.weebly.com*Per professor, to correct trendline of graph 2, include only values reached until 3.5 minutes. GRAPH 1: 6 Calculations of unit of enzymes in reactions: Sample 1 with 0.2 mL glucose oxidase: (0.2 mL glucose oxidase) x (7.0 units/mL enzyme concentration) = 1.4 unit of enzyme

of DEVELOPMENTAL PSYCHOLOGY
www.gse.harvard.edu492 DEVELOPMENT IN ADULTHOOL) Single Trendline of Development in One Direction (Alexander et a!., 1990; Baltes, 1987; Basseches, 1984; Berg, 2000; Commons et al ...

Thermochemistry: The Heat of Neutralization
web.gccaz.eduo Select the “Add Trendline” option. o Select the Linear option. o At the bottom of the page, select “Display Equation on Chart” and “Display R-squared value on chart”. The y-intercept value will represent the Final Temperature for each reaction (if there hadn’t been heat leaks). o Click OK. • Double click in the chart.

Obtaining Uncertainty Measures on Slope and Intercept of a ...
pages.mtu.eduThe trendline was inserted as follows: Right click on data on chart, Add trendline, Linear, Display Equation on chart, Display R‐ squared value on chart. The trendline function, however, does not give us the value of the variances

Creating And Publishing Interactive Dashboards With …
cair.orgThe trendline can be formatted to look different from the data line. The trendline can forecast forward on periods. You also have the option to add the equation and R-squared value. Chart with Trendline and Default Range. Formatting axis by selecting minimum and maximum ranges.
Lumber and Timber Price Trends Analysis During the COVID ...
tfsweb.tamu.eduaccounts for the largest proportion of growthwith an increasing trend (linear trendline in Figure 4). The south had a population of 126 million in 20194 which was 38.3 percent of the U.S. total. Incidentally, much of the growth occurred in Texas which has seen its population grow by 40