Hypothesis Testing
Properties of hypothesis testing 1. and are related; decreasing one generally increases the other. 2. can be set to a desired value by adjusting the critical value. Typically, is set at 0.05 or 0.01. 3.Increasing ndecreases both and . 4. decreases as the distance between the true value and
Download Hypothesis Testing

Information
Domain:
Source:
Link to this page:
Documents from same domain

Digital Image Processing - Scientific Computing …
www.sci.utah.eduIntroduction Preview Interest in digital image processing methods stems from two principal applica-tion areas:improvement of pictorial information for human interpretation;and

Digital Image Processing - Scientific Computing …
www.sci.utah.edu2 of 36 References “Digital Image Processing”, Rafael C. Gonzalez & Richard E. Woods, Addison-Wesley, 2002 –Much of the material that follows is taken from
Hypothesis Testing
www.sci.utah.eduWhat is hypothesis testing? A statistical hypothesis is an assertion or conjecture concerning one or more populations. To prove that a …

Particle-Based Simulation of Fluids
www.sci.utah.eduParticle-Based Simulation of Fluids Simon Premože1, Tolga Tasdizen2, James Bigler2, ... heat and mass transfer, molecular dynamics, and fluid and solid mechanics.

A Tutorial on Probability Theory
www.sci.utah.eduA Tutorial on Probability Theory Paola Sebastiani Department of Mathematics and Statistics University of Massachusetts at Amherst Corresponding Author: Paola Sebastiani. Department of Mathematics and Statistics, University
Ion Transport, Resting Potential, and Cellular Homeostasis ...
www.sci.utah.eduIon Transport, Resting Potential, and Cellular Homeostasis Introduction These notes cover the basics of membrane composition, transport, resting potential, and cellular homeostasis. After a brief introduction to the first two topics, we will spend most of our time on ... We will discuss ions that are subject both to diffusion and to an electric ...

Carbon-13Chemical ...
www.sci.utah.edueighteen lines group into three sets of six closely positioned congruent carbon bands with some lines resolved in each set. In this work, the FIREMAT experiment 7 isolated 11 sideband

Image Rectification (Stereo) - sci.utah.edu
www.sci.utah.eduAlgorithm Rectification Following Trucco & Verri book pp. 159 •known T and R between cameras •Rotate left camera so that epipole e l goes to infinity along horizontal axis •Apply same rotation to right camera to recover geometry •Rotate right camera by R-1 •Adjust scale
Fourier Transform in Image Processing
www.sci.utah.edu• Fourier Series: Represent any periodic function as a weighted combination of sine and cosines of different frequencies. • Fourier Transform: Even non-periodic functions with finite area: Integral of weighted sine and cosine functions. • Functions (signals) can be completely reconstructed from the Fourier domain without loosing any ...
Related documents

Using Your TI-83/84 Calculator for Hypothesis Testing: The ...
users.rowan.eduUsing Your TI-83/84 Calculator for Hypothesis Testing: The 1-Proportion z Test Dr. Laura Schultz The 1-proportion z test is used to test hypotheses regarding population proportions. This handout will take you through one of the examples we will be considering during class.

Hypothesis Testing with z Tests - University of Michigan
www-personal.umd.umich.eduwill reject the null hypothesis (cutoffs) p levels (α): Probabilities used to determine the critical value 5. Calculate test statistic (e.g., z statistic) 6. Make a decision Statistically Significant: Instructs us to reject the null hypothesis because the pattern in the data differs from whldbhlhat we would expect by chance alone.

Using Excel, Chapter 8: Hypothesis Testing - One Sample
cosmosweb.champlain.eduChapter 8.2 - Hypothesis Testing About a Proportion Notation { Test Statistic = z ^p = p^ p q pq n { Signi cance Level = (in decimal form) { Critical Values = z or z =2 Finding Critical Values Here we use the NORM.S.INV function. NORM.S.INV stands for the inverse of the standard normal distribution (z-distribution).
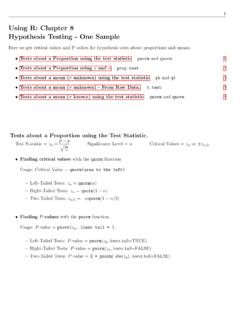
Using R: Chapter 8 Hypothesis Testing - One Sample
cosmosweb.champlain.eduUsing R: Chapter 8 Hypothesis Testing - One Sample Here we get critical values and P-values for hypothesis tests about proportions and means. Tests about a Proportion using the test statistic pnorm and qnorm. 1 Tests about a Proportion using xand n prop.test 2 Tests about a mean (˙unknown) using the test statistic pt and qt 3

Chapter 6 Hypothesis Testing - University of Pittsburgh
sites.pitt.eduAn Alternative Decision Rule using the p - value Definition The p-value is defined as the smallest value of α for which the null hypothesis can be rejected. If the p-value is less than or equal to α ,we reject the null hypothesis (p ≤ α) If the p-value is greater than α ,we do not reject the null hypothesis (p > α)

Hypothesis Testing Cheat Sheet - QI Macros
www.qimacros.comThree Hypothesis Testing Methods 1. Classical: Compare a test statistic to a critical value. 2. p value: Probability of a test statistic being contrary to the null hypothesis. 3. Confidence Interval: Is the test statistic between or outside of the confidence interval. Hypothesis testing can be used in businesses to identify differences be-
Introduction to Hypothesis Testing
www.sagepub.comand Hypothesis Testing 8.2 Four Steps to Hypothesis Testing 8.3 Hypothesis Testing and Sampling Distributions 8.4 Making a Decision: 8.5 Testing a Research Using the z Test 8.6 Research in Focus: Directional Versus Nondirectional Tests 8.7 Measuring the Size of an Effect: Cohen’s d 8.8 Effect Size, Power, and Sample Size
Hypothesis Testing - Duke University
www2.stat.duke.edu23.1 How Hypothesis Tests Are Reported in the News 1. Determine the null hypothesis and the alternative hypothesis. 2. Collect and summarize the data into a test statistic. 3. Use the test statistic to determine the p-value. 4. The result is statistically significant if the p-value is less than or equal to the level of significance.