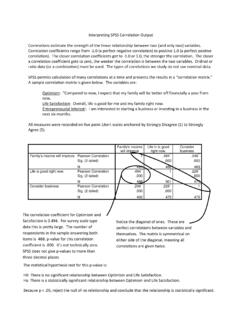
Interpreting SPSS Correlation Output
Interpreting SPSS Correlation Output Correlations estimate the strength of the linear relationship between two (and only two) variables. Correlation coefficients range from -1.0 (a perfect negative correlation) to positive 1.0 (a perfect positive correlation). The closer correlation coefficients get to -1.0 or 1.0, the stronger the correlation.
Download Interpreting SPSS Correlation Output

Information
Domain:
Source:
Link to this page:
Documents from same domain

Journal of Humanistic Psychology - University of …
academic.udayton.eduJournal of Humanistic Psychology 2006; 46; 239 Five Basic Postulates of Humanistic Psychology http://jhp.sagepub.com The online version of this article can be found ...

10e 12 Chap Student Workbook - University of Dayton
academic.udayton.eduChapter 12: Managerial Decisions for Firms with Market Power 248 3. The degree to which a firm possesses market power is inversely related to the price elasticity of demand. The less (more) elastic the firm’s demand, the greater (less)

Life Satisfaction Set Point: Stability and Change
academic.udayton.eduof the sample changed an average of 3 or more points on a 10-point scale from the first 5 to last 5 years of the study. The purpose of this study was to explore the degree to which life
Chapter 1 What is Economics? Test bank MULTIPLE CHOICE ...
academic.udayton.eduChapter 1 What is Economics? Test bank MULTIPLE CHOICE. Choose the one alternative that best completes the statement or answers the question. 1)An incentive A)is the opposite of a tradeoff. B)could be a reward but could not be a penalty. C)could be either a reward or a penalty.

Chapter 3 - Demand and Supply - Sample Questions MULTIPLE ...
academic.udayton.eduChapter 3 - Demand and Supply - Sample Questions Answers are at the end fo this file MULTIPLE CHOICE. Choose the one alternative that best completes the statement or answers the question.
Chapter 4 - Elasticity - Sample Questions MULTIPLE CHOICE ...
academic.udayton.eduA)The price elasticity of demand is larger at point A than at point B. B)The price elasticity of demand is constant because the slope is constant. C)The price elasticity of demand increases moving from point A to point B to point C to point D

Chapter 8.4 Failure Mode and Effects Analysis (FMEA)
academic.udayton.eduFailure Mode and Effects Analysis (FMEA for short) is a systematic way to identify and evaluate the potential failures of a product or process. It provides a formal process for eliminating or mitigating the risks of a failure. ... Assess the effect of the failure mode on the

Managing Oneself - University of Dayton
academic.udayton.eduCreated Date: 1/1/2008 12:00:00 AM

Marketing Channel Strategy and Analysis
academic.udayton.eduMarketing Channel Strategy and Analysis ... series of firms and exchanges are called channels of distribution. At each point in a channel where exchanges occur, marketing is involved to facilitate the exchanges. ... chain centers on the logistical functions while channels represent the exchange relationships of channel

Life Story Interview Project Overview Choosing a person to ...
academic.udayton.eduEach life story has key episodes or events, each of which happened at a specific time in a specific place with specific people, and each elicited particular thoughts and feelings. Examples of these events include a/an (ask for 1 or 2 of each or some of these episodes): • High point in life
Related documents
Interpreting iron studies
eprints.gla.ac.ukInterpreting iron studies ... 10.1136/bmj.j2513 (Published 2017 June 15) Page 1 of 6 Practice PRACTICE. What you need to know •Iron overload typically results in a high ferritin and transferrin saturation •Iron deficiency is best assessed using serum ferritin, which is low in the absence of inflammation •Ferritin levels can be elevated by ...
Sample APA Research Paper - The Write Source
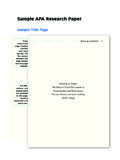
www.thewritesource.comSample Title Page Running on Empty 1 Running on Empty: The Effects of Food Deprivation on Concentration and Perseverance Thomas Delancy and Adam Solberg Dordt College Place manuscript page headers one-half inch from the top. Put five spaces between the page header and the page number. Full title, authors, and school name are centered on the page,

ASQ-3 Scoring Help
agesandstages.comscore using the ASQ®-3 Quick Start Guide chart, or follow the instructions on page 72 of the ASQ®-3 User’s Guide. 6. Transfer scores and information to the ASQ-3 Information Summary sheet Total the points in each of the ˜ve developmental areas and record the scores on the scoring sheet— and compare results to the area cuto˚s.

Using Operating Characteristic (OC) Curves to Balance Cost ...
www.afit.eduPage 5 use the percent defective default, but other options include the proportion defective or defectives per million. The first two inputs boxes are the AQL and RQL in percent defective. Therefore enter 10 for a 0.90 proportion and 20 for a 0.80 proportion. Here alpha and beta are set to 0.1 and 0.1 and the results are shown in Figure 1.
Interpreting a covid-19 test result - BMJ
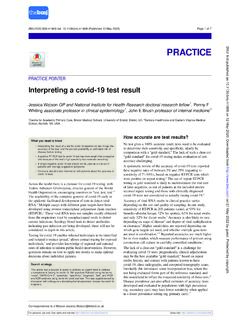
www.bmj.comMay 12, 2020 · PRACTICE POINTER Interpreting a covid-19 test result Jessica Watson GP and National Institute for Health Research doctoral research fellow 1, Penny F Whiting associate professor in clinical epidemiology 1, John E Brush professor of internal medicine 2 1Centre for Academic Primary Care, Bristol Medical School, University of Bristol, Bristol, UK; 2Sentara …
Antigen Test Algorithm
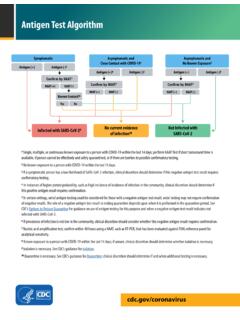
www.cdc.govDec 14, 2020 · of negative results. The role of a negative antigen test result in ending quarantine depends upon when it is performed in the quarantine period. See CDC’s Options to Reduce Quarantine for guidance on use of antigen testing for this purpose and when a negative antigen test result indicates not infected with SARS-CoV-2. analytical sensitivity.
Interpretation of Hepatitis B Serologic Test Results
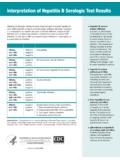
www.cdc.govInterpretation of Hepatitis B Serologic Test Results Hepatitis B serologic testing involves measurement of several hepatitis B virus (HBV)-specifi c antigens and antibodies. Different serologic “markers” or combinations of markers are used to identify different phases of HBV infection and to determine whether a patient has acute or chronic HBV

Microbiology guide to interpreting minimum inhibitory ...
www.idexx.comEnrofloxacin ≤0.5 1–2 ≥4 Erythromycin ≤0.5 1–4 ≥8 Florfenicol ≤2 4‡ ≥8 Gentamicin gram-negative ≤2 4 ≥8 Gentamicin Staphylococcus ≤4 8 ≥16 Imipenem gram-negative ≤2 4 ≥8 Marbofloxacin ≤1 2 ≥4 Minocycline (skin and soft tissue) ≤0.5 1 ≥2 Nitrofurantoin (only reported on urine cultures) ≤32 64 ≥128