Introductory Statistics Notes - Stat-Help.com
Introductory Statistics Notes Jamie DeCoster Department of Psychology University of Alabama 348 Gordon Palmer Hall Box 870348 Tuscaloosa, AL 35487-0348
Download Introductory Statistics Notes - Stat-Help.com

Information
Domain:
Source:
Link to this page:
Documents from same domain
Overview of Factor Analysis - Stat-Help.com
www.stat-help.comChapter 1 Theoretical Introduction † Factor analysis is a collection of methods used to examine how underlying constructs in°uence the responses on a number of measured variables. † There are basically two types of factor analysis: exploratory and conflrmatory. – Exploratory factor analysis (EFA) attempts to discover the nature of …
Data Analysis in SPSS Department of Psychology
www.stat-help.comData Analysis in SPSS Jamie DeCoster Department of Psychology University of Alabama 348 Gordon Palmer Hall Box 870348 Tuscaloosa, AL 35487-0348
Transforming and Restructuring Data - Stat …
www.stat-help.com•For analysts to do anything with a group of data they must first translate it into a data set. A data set is a representation of data, defining a set of “variables” that are measured on a set of “cases.”
Testing Group Difierences using T-tests, ANOVA, …
www.stat-help.comTesting Group Difierences using T-tests, ANOVA, and Nonparametric Measures Jamie DeCoster Department of Psychology University of Alabama 348 Gordon Palmer Hall
Scale Construction Notes - Stat-Help.com
www.stat-help.comScale Construction Notes Jamie DeCoster Department of Psychology University of Alabama 348 Gordon Palmer Hall Box 870348 Tuscaloosa, AL …
References on Mediation Social Psychology, 51, …
www.stat-help.comReferences on Mediation Baron, R. M., & Kenny, D. A. (1986). The moderator-mediator variable distinction in social psychological research: Conceptual, strategic, and ...
Meta-Analysis Notes - Stat-Help.com
www.stat-help.comChapter 1 Introduction and Overview 1.1 Basics † Deflnition of meta-analysis (from Glass, 1976): The statistical analysis of a large collection of analysis results for the purpose of integrating the flndings. † The basic purpose of meta-analysis is to provide the same methodological rigor to a literature review that we require from experimental …
Related documents

INTRODUCTION TO IMAGE PROCESSING - drkmm.com
drkmm.comReadings in Image Processing OVERVIEW OF IMAGE PROCESSING K.M.M. Rao*,Deputy Director,NRSA,Hyderabad-500 037 Introduction Image Processing is a technique to enhance
Introduction to Python - Harvard University
tdc-www.harvard.eduIntroduction to Python Heavily based on presentations by Matt Huenerfauth (Penn State) Guido van Rossum (Google) Richard P. Muller (Caltech)... Monday, October 19, 2009
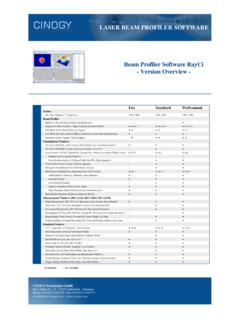
LASER BEAM PROFILER SOFTWARE Beeaamm PPrrooffiilleer ...
www.cinogy.comLite Standard Professional System XP, Vista, Windows 7, 32Bit / 64BitWindows 8 32Bit / 64Bit Beam Profiler Multi-Use (Several Beam Profilers simultaneously)

Rozkłady empiryczne i wyznaczanie estymatorów wartości ...
www.if.pw.edu.plRysunek 2: Histogram czasów spadania dla danych jak na rys 4. Niebieskie słupki- histogram empiryczny, czerwone - histogram wyznaczony z równania na wykresie 4.
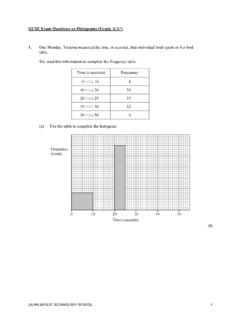
GCSE Exam Questions on Histograms (Grade A/A*) 1.
www.mathsarea.co.ukLILIAN BAYLIS TECHNOLOGY SCHOOL 1 GCSE Exam Questions on Histograms (Grade A/A*) 1. One Monday, Victoria measured the time, in seconds, that individual birds spent on her bird

METAL SHARK® 2 BD
www.metal-shark.com3. Safety Messages 3.1. Safety Symbols and Definitions In this manual we use the following safety symbols. These symbols are supposed to draw the
CQE Sample Exam - Ontario College of Technology
www.ocot.caCQE-SAMPLE EXAM 6 26. Which of the following tools is NOT used to compare process performance to specifications? (A) Frequency distribution histogram
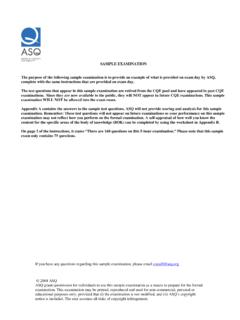
What is a Histogram? When should we use a Histogram?
www.saferpak.comHISTOGRAM VIEWGRAPH 1 What Is a Histogram? • A bar graph that shows the distribution of data • A snapshot of data taken from a process 0 5 10 15 20 25 30 35 40 45 50 55 60