Lecture 7: Hypothesis Testing and ANOVA
Fisher’s Exact Test Wilcoxon-Mann-Whitney Test Two sample t-test Compare two unpaired groups Paired t-test Wilcoxon Test McNemar’s Test Compare two paired groups Wilcoxon Test Binomial Test One sample t-test Compare one group to a hypothetical value. General Form of a t-test! T= x "µ ...
Download Lecture 7: Hypothesis Testing and ANOVA

Information
Domain:
Source:
Link to this page:
Documents from same domain
Lecture 10: Multiple Testing - UW Genome Sciences
www.gs.washington.eduWhy Multiple Testing Matters Genomics = Lots of Data = Lots of Hypothesis Tests A typical microarray experiment might result in performing 10000 separate hypothesis tests.
DNA Isolation from Strawberries
www.gs.washington.edusource for extracting DNA because they are easy to pulverize and contain enzymes called pectinases and cellulases that help to break down cell walls. And most important, strawberries have eight copies of each chromosome (they are octoploid), so there is a lot of DNA to isolate. The purpose of each ingredient in the procedure is as follows:
Lecture 10: Multiple Testing
www.gs.washington.eduFalse Discovery Rate m 0 m-m 0 m V S R Called Significant U T m - R Not Called Significant True True Total Null Alternative V = # Type I errors [false positives] •False discovery rate (FDR) is designed to control the proportion of false positives among the set of rejected hypotheses (R)
Lecture 4: Random Variables and Distributions
www.gs.washington.edu•Before data is collected, we regard observations as random variables (X 1,X 2,…,X n) •This implies that until data is collected, any function (statistic) of the observations (mean, sd, etc.) is also a random variable •Thus, any statistic, because it is a random variable, has a probability distribution - referred to as a sampling ...
I-9 Form: Instructions for Nonresident on H-1B or TN Visa
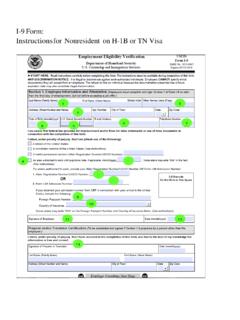
www.gs.washington.eduI-9 Form: Instructions for Nonresident on H-1B or TN visa Instructions for both New Hires and Updating & Reverification For more detailed information about completing Form I-9, employers and employees should refer to the Handbook for Employers: Instructions for Completing Form I-9 (M-274). _____
Lecture 5: Estimation - University of Washington
www.gs.washington.eduBayesian Estimation: ÒSimpleÓ Example ¥I want to estimate the recombination fraction between locus A and B from 5 heterozygous (AaBb) parents. I examine 30 gametes for each and observe 4, 3, 5, 6, and 7 recombinant gametes in the Þve parents. What is the mle of the recombination fraction? ¥Tedious to show Bayesian analysis. LetÕs simplify ...
Lecture 9: Linear Regression - University of Washington
www.gs.washington.eduLecture 9: Linear Regression. Goals • Linear regression in R •Estimating parameters and hypothesis testing ... •Previous coding would result in colinearity •Solution is to set up a series of dummy variable. In general for k levels you need k-1 dummy variables x 1 …
1. Plasmid structure 2. Plasmid replication and copy ...
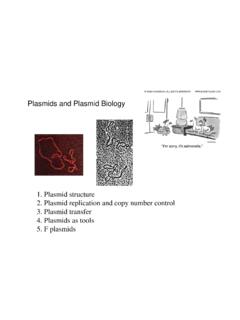
www.gs.washington.eduPlasmid replication requires host DNA replication machinery. 2. Most wild plasmids carry genes needed for transfer and copy number ... Large or small region of homologous DNA cloned that will integrate into the chromosomal target. 5. Need a counter selection method to kill the donor cells 6. Screen for what you think is correct.
Lecture 2: Descriptive Statistics and Exploratory Data ...
www.gs.washington.eduMultivariate Data •Organize units into clusters •Descriptive, not inferential •Many approaches •“Clusters” always produced Clustering Data Reduction Approaches (PCA) •Reduce n-dimensional dataset into much smaller number •Finds a new (smaller) set of variables that retains most of the information in the total sample
Related documents
Developing the Four-Stage Supervision Model for Counselor ...
files.eric.ed.govWilcoxon signed-rank test and frequency were used in analyzing the quantitative data, and the descriptive method was used in analyzing the qualitative data. Research findings from the quantitative part of the study indicate that counselor trainees made 280 mistakes at 92.71% over the first five supervision sessions, while
Mann-Whitney U test (Non-parametric equivalent to ...
www.sheffield.ac.ukMann-Whitney U test (Non-parametric equivalent to independent samples t-test) The Mann-Whitney U test is used to compare whether there is a difference in the dependent variable for two independent groups. It compares whether the distribution of the dependent variable is the same for the two groups and therefore from the same population.
14.1 The Wilcoxon Rank Sum Test - University of Florida
users.stat.ufl.edu14.1 The Wilcoxon Rank Sum Test 1 2 12 1 12 5 This test was invented by Frank Wilcoxon (1892–1965) in 1945. Wilcoxon was a chemist who met statistical problems in his work at the research laboratories of American Cyanimid Company. The Wilcoxon rank sum test The Wilcoxon Rank Sum Test

Two-Tailed Test One-Tailed Test α
users.stat.ufl.eduCritical Values of the Wilcoxon Signed Ranks Test Two-Tailed Test One-Tailed Test n α = .05 α = .01 α = .05 α = .01 5 -- -- 0 -- 6 0 -- 2 -- 7 2 -- 3 0 8 3 0 5 1 9 5 1 8 3 10 8 3 10 5 11 10 5 13 7 12 13 7 17 9 13 17 9 21 12 14 21 12 25 15 15 25 15 30 19 16 29 19 35 23 17 34 23 41 27 18 40 27 47 32 19 46 32 53 37 20 52 37 60 43

J.1 Table of Critical Values for the Wilcoxon Rank-Sum Test
plantsys.elte.huThe tables on the following pages provide critical values for the Wilcoxon rank-sum test for independent samples with sizes from 3 to 25. Column mis the sample size for the smaller sample and column nis the sample size for the larger sample. If the sample sizes are equal,

The Wilcoxon test - University of Sussex
users.sussex.ac.ukWilcoxon test is unusual in this respect: normally, the BIGGER the test statistic, the less likely it is to have occurred by chance). This handout deals with using Wilcoxon with small sample sizes. If you have a large number of participants, you can convert W into a z-score and look this up instead. The same is true for the Mann-Whitney test.

Table of critical values for the Wilcoxon test
users.sussex.ac.ukWilcoxon's test statistic to the critical value in the table (taking into account N, the number of subjects). Your obtained value is statistically significiant if it is equal to or SMALLER than the value in the table. e.g.: suppose my obtained value is 22, and I had 15 participants.
Marijuana Impaired Driving - Addictions, Drug & Alcohol ...
adai.uw.edutimes. We conducted Wilcoxon rank-sum test tests of differences in median blood draw times for Δ9-THC versus carboxy-THC. A scatter plot with locally weighted regression lines was created to examine the relationship between ETBD and Δ9-THC level. Linear regression analyses were conducted to test the relationship between ETBD and Δ9-