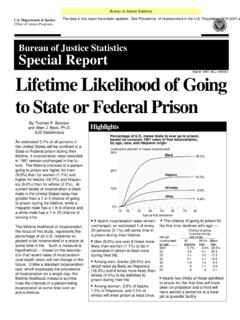
Lifetime Likelihood of Going to State or Federal Prison
current levels of incarceration a black male in the United States today has greater than a 1 in 4 chance of going to prison during his lifetime, while a Hispanic male has a 1 in 6 chance and a white male has a 1 in 23 chance of serving time. The lifetime likelihood of incarceration, the focus of this study, represents the
Download Lifetime Likelihood of Going to State or Federal Prison
Information
Domain:
Source:
Link to this page:
Documents from same domain

Family Violence Statistics
bjs.ojp.gov3.5 million victims of family violence between 1998 and 2002, less than 1% died as a result of the incident. The majority (73%) of family violence victims were female. Females were 84% of spouse abuse victims and 86% of victims of abuse at the hands of a boyfriend or girlfriend.

Human Trafficking Data Collection Activities, 2021
bjs.ojp.govHuman Trafficking Data Collection Activities, 2021. The Combat Human Trafficking Act of 2015 (CHTA) (34 U.S.C. § 20709(e)) requires the director of the . Bureau of Justice Statistics (BJS) to prepare an annual report on human trafficking. The report must include information on the following: arrests for human-trafficking offenses by state law

Correctional Populations in the United States, 2019 ...
bjs.ojp.govauthority of a sheriff, police chief, or city or county administrator. Facilities are intended for adults but may hold juveniles before or after they are adjudicated. Facilities include jails, detention centers, city or county correctional centers, special jail facilities (such as medical or treatment centers and prerelease centers)

Education and Correctional Populations - Bureau of Justice ...
bjs.ojp.gov2 Education and Correctional Populations Sources: BJS, Survey of Inmates in State and Federal Correctional Facilities, 1997 and 1991; BJS, Survey of Inmates in Local Jails, 1996 and 1989; BJS, Survey of Adults on Probation, 1995; Bureau of Labor Statistics, Current Population Survey, March supplement, 1997.

Mental Health Problems of Prison
bjs.ojp.gov• Female inmates had higher rates of mental health problems than male inmates (State prisons: 73% of females and 55% of males; local jails: 75% of females and 63% of males). • About 74% of State prisoners and 76% of local jail inmates who had a mental health problem met criteria for substance dependence or abuse.

Substance Dependence, Abuse, and Treatment of Jail Inmates ...
bjs.ojp.govOver half of all female jail inmates reported substance dependence There was little difference in the overall prevalence of substance dependence or abuse between men (68%) and women (69%) in local jails (table 2). When substance dependence or abuse was estimated separately, female jail inmates had higher rates of substance dependence than male ...

Bureau of Justice Statistics Special Report
bjs.ojp.govdiffered substantially in their relation-ship to those they victimized. An estimated 62% of female violent offenders had a prior relationship with the victim as an intimate, relative, or acquaintance. By contrast, about 36% of male violent offenders were estimated to have known the victim. Victims who were intimates accounted
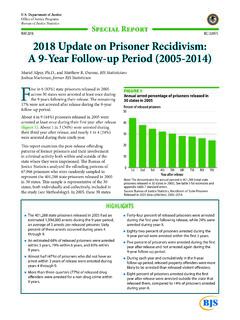
2018 Update on Prisoner Recidivism: A 9-year Follow-up ...
bjs.ojp.govTis report examines the post-release ofending . 20 patterns of former prisoners and their involvement in criminal activity both within and outside of the 10 state where they were imprisoned. Te Bureau of Justice Statistics analyzed the ofending patterns of 0 67,966 prisoners who were randomly sampled to

Federal Prisoner Statistics Collected under the First Step ...
bjs.ojp.govFederal Prisoner Statistics Collected under the First Step Act, 2021. T. he First Step Act of 2018 (FSA) requires . the Bureau of Justice Statistics (BJS), through its National Prisoner Statistics program, to collect data from the Federal Bureau of Prisons (BOP) on a number of topics and to report these data annually. 1 . BJS is required to

Mortality in Local Jails, 2000–2019 – Statistical Tables
bjs.ojp.govmortality data, up slightly from 180 in 2018. When the U.S. resident population was adjusted to resemble the sex, race or ethnicity, and age distribution of local jail inmates, inmates were more than twice as likely as U.S. residents to die by suicide in 2019. Almost 77% of …
Related documents
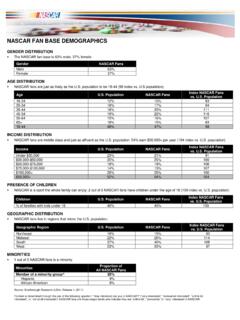
NASCAR FAN BASE DEMOGRAPHICS - Brent Sherman
brentsherman.comThe NASCAR fan base is 63% male, 37% female. Gender NASCAR Fans Male 63% Female 37% . AGE DISTRIBUTION NASCAR fans are just as likely as the U.S. population to be 18-44 (98 index vs. U.S population). Age U.S. Population NASCAR Fans Index NASCAR Fans vs. U.S. Population 18-24 12% 10% 83 25-34 18% 17% 94 35-44 18% 20% 111
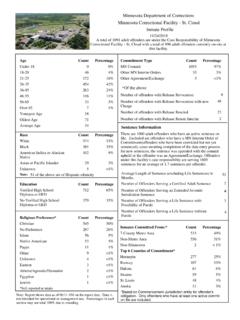
Minnesota Department of Corrections Minnesota Correctional ...
coms.doc.state.mn.usBlack 306 32% American Indian or Alaskan Native 98 10% Unknown 7 <1% White 506 54% 46 of the above are of Hispanic ethnicity *Of the above Commitment Type Count Percentage MN Commit 916 97% Other MN Interim Orders 21 2% Other Agreement/Exchange 5 <1% Number of offenders with Release Revocation 11 Number of offenders with Release Revocation with ...

Black Male Student Success in Higher Education
web-app.usc.eduin Black male student success have much to learn from Black men who have actually been successful. To increase their educational attainment, the popular one-sided emphasis on failure and low-performing Black male undergraduates must be counterbalanced with insights gathered from those who somehow manage to

Genetics: X Linked Genes - The Biology Corner
www.biologycorner.comgene have black and oRange splotches on white coats. Males can only be black or orange, but never calico. Here’s what a calico female’s genotype would look like. X B X R Show the cross of a female calico cat with a black male? What percentage of the kittens will be black and male? _____ What percentage of the kittens will be calico and male?

Vital Statistics Rapid Release - Centers for Disease ...
www.cdc.govnon-Hispanic black males whose life expectancy declined by 3.0 years (71.3 to 68.3), followed in order by Hispanic males with a decline of 2.4 years (79.0 to 76.6), non-Hispanic black females with a decline of 2.3 years (78.1 to 75.8), Hispanic females with a decline of 1.1 years (84.4 to 83.3), non-Hispanic white
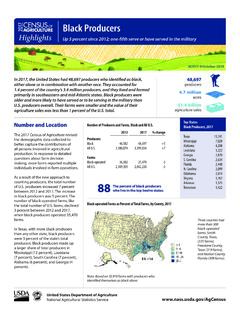
Black Producers - National Agricultural Statistics Service
www.nass.usda.govBlack Producers, 2017 Number = 48,697* Black All U.S. (percent) Sex Male 71 64 Female 29 36 Age <35 6 8 35 - 64 51 58 65+ 43 34 Years farming 10 or less 29 27 11 or more 71 73 Lived on their farm 61 74 Worked off farm No days 40 39 1 to 199 days 25 21 200+ days 35 40 Primary occupation Farming 44 42 Other 56 58 Hispanic 3 3 With military ...