MATHEMATICS
data using a bar graph / histogram and estimate the mode. • To use a newspaper to study and report on shares and dividends. • Set up a dropper with ink in it vertical at a height say 20 cm above a horizontally placed sheet of plain paper. Release one ink drop; observe the pattern, if any, on the paper. Vary the vertical distance and repeat.
Download MATHEMATICS

Information
Domain:
Source:
Link to this page:
Documents from same domain
12. ISC Psychology Scope - Revised
cisce.org61 PAPER - II (PRACTICAL WORK) – 30 Marks Candidates will be expected to have completed two studies / experiments from any chapter covered in
Time Table of ISC Year 2018 Examinations - Council …
cisce.orgThe dates mentioned in the Time Table for the ISC Year 2018 Examinations may be subject to change based on the declaration of the dates by the Chief Election Commissioner of India for the States due for

REGULATIONS INDIAN CERTIFICATE OF …
cisce.org1 REGULATIONS INDIAN CERTIFICATE OF SECONDARY EDUCATION EXAMINATION THE COUNCIL Origin 1. The Council for the Indian School Certificate
Council for the Indian School Certificate …
cisce.orgCouncil for the Indian School Certificate Examinations New Delhi CISCE RULES FOR AFFILIATION Registration No. S-3542 dated 19.12.1967 Registered under
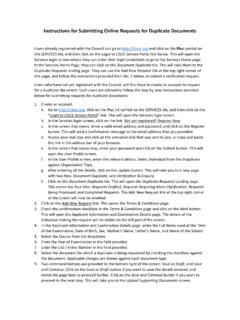
Instructions for Submitting Online Requests for …
cisce.orgInstructions for Submitting Online Requests for Duplicate Documents Users already registered with the Council can go to http://cisce.org and click on the Plus symbol on ...
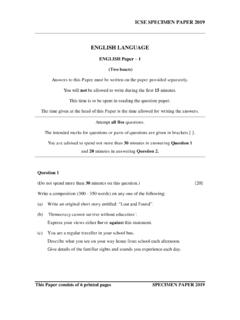
ENGLISH - CISCE
cisce.org5 SPECIMEN PAPER 2019 Question 5 (a) Fill in each of the numbered blanks with the correct form of the word given in brackets. Do not copy the passage but write in correct serial order the word or phrase
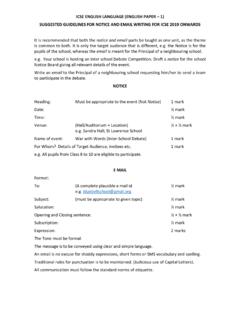
Suggested guidelines for notice and email writing - …
cisce.orgICSE ENGLISH LANGUAGE (ENGLISH PAPER – 1) SUGGESTED GUIDELINES FOR NOTICE AND EMAIL WRITING FOR ICSE 2019 ONWARDS It is recommended that both the notice and email parts be taught as one unit, as the theme
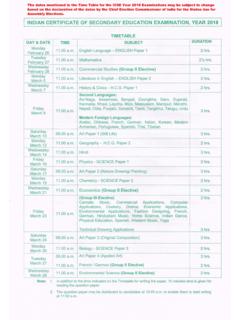
Time Table of ICSE Year 2018 Exam - CISCE
cisce.orgThe dates mentioned in the Time Table for the ICSE Year 2018 Examinations may be subject to change based on the declaration of the dates by the Chief Election Commissioner of India for the States due for
ENGLISH (01) - CISCE
cisce.org13 ENGLISH (01) Aims: 1. To develop and integrate the use of the four language skills i.e. listening, speaking, reading and writing for the purpose of effective
COUNCIL FOR THE INDIAN SCHOOL CERTIFICATE ... …
cisce.orgNOTICE COUNCIL FOR THE INDIAN SCHOOL CERTIFICATE EXAMINATIONS Pragati House, 3rd Floor, 47 – 48 Nehru Place, New Delhi – 110 505 Telephones : 26411706, 26413820, email : council@cisce.org
Related documents

Valuation: Discounted Cash Flow (DCF) Model
users.design.ucla.eduEstimate the Terminal Value (step three of four) ♦ The Terminal Value is the value of the business beyond the specified forecast period (e.g. the projected value of the company for 30 years into the future) 1) Exit Multiple Method 2) Perpetuity Growth Method
CoVaR - Princeton University
scholar.princeton.edumaturity mismatch, and asset price booms signi cantly predict CoVaR . We also provide out-of-sample forecasts of a counter-cyclical, forward-looking measure of systemic risk, and show that the 2006Q4 value of this measure would have predicted more than one third of realized CoVaR during the 2007-09 nancial crisis. JEL: G01, G10, G18, G20, G28 ...

Hemp Sampling Guidelines Issued January 15, 2021
www.ams.usda.gov2.1. The sampling agent should estimate the average height, appearance, approximate density, condition of the plants, and degree of maturity of the inflorescences (flowers/buds). 2.2. The sampling agent should visually establish the homogeneity of the stand to establish that the growing area is of like variety. 3.Time of Sampling:

Methods for assessing fish populations
www.fs.fed.usmaturity schedules, or fecundity of fish in a population are central to informed decision mak- ... For example, using electrofishing and the removal method to estimate the number of trout in ... ate an estimate of fish abundance. A primary assumption of the model is that sampling efficiency, or the proportion of fish removed from a site per ...
Loan Fact Sheet - Small Business Administration
www.sba.govThis method makes it easier and faster for lenders to provide small business loans of $350,000 or less, with SBA generally providing a loan ... Prepare a detailed estimate of how much capital will be needed to start. State how much you have and how much you will need to borrow. ... Fees for loan maturity of 12 months or less: -.25% (1/4 of 1% ...

TD Ameritrade Clearing Inc. FY20 Statement of Financial ...
www.tdameritrade.comcurrently unable to estimate the long-term effects of the pandemic on its financial condition. Effective October 3, 2019, TD Ameritrade, Inc. re duced its online exchange-listed stock, exchange traded funds (ETF) (domestic and Canadian) and …