
Multiple Imputation of Missing Data Using Stata
imputation model should always include all the variables in the analysis model, including the dependent variable of the analytic model as well as any other variables that may provide information about the probability of missigness, or about the true value of the missing data. Theory should guide the decision as to which variables to include.
Download Multiple Imputation of Missing Data Using Stata

Information
Domain:
Source:
Link to this page:
Documents from same domain
Introduction to RStudio
dss.princeton.eduThe console is where you can type commands and see output The workspace tab shows all the active objects (see next slide). The history tab shows a list of commands used so far. The files tab shows all the files and folders in your default workspace as if you were on

Getting Started in Data Analysis using Stata
dss.princeton.eduFrom SPSS/SAS to Stata Example of a dataset in Excel From Excel to Stata (copy-and-paste, *.csv) Describe and summarize Rename Variable labels Adding value labels Creating new variables (generate) Creating new variables from other variables (generate) Recoding variables (recode) Recoding variables using egen

Panel Data Analysis Fixed and Random Effects using Stata ...
dss.princeton.eduPU/DSS/OTR Fixed Effects using least squares dummy variable model (LSDV). 16 _cons 8.81e+08 9.62e+08 0.92 0.363 -1.04e+09 2.80e+09

Linear Regression using Stata - Princeton University
dss.princeton.edubetween X and Y. R-square shows the amount of variance of Y explained by X. In this case expenseexplains 22% of the variance in SAT scores. Lets run the regression: regress . csat expense, robust. Adj R. 2 (not shown here) shows the same as . R. 2. but adjusted by the # of cases and # of variables. When the # of variables is small and the # of ...

Data Preparation/Descriptive Statistics
dss.princeton.eduextensions are *.txt for tab-separated data and *.prn for space-separated data. Any statistical package can read these formats. •Record form (or fixed). Data is structured by fixed blocks (for example, var1 in columns 1 to 5, var2 in column 6 to 8, etc). You will need a codebook and to write a program (either in Stata, SPSS or SAS) to read ...
Notes on Exploring Data - Princeton University
dss.princeton.eduSPSS . SAS . Stata . JMP (SAS) R . Python (Pandas) Learning curve Gradual . Pretty steep Gradual . Gradual . Pretty steep Steep . User interface Point-and-click . Programming . Programming/ point-and-click . Point-and-click . Programming Programming Data manipulation Strong . Very strong Strong .
Related documents
Metadata Submission Guidelines Appendix to the Study …
clinicalsafetygeek.comData Tabulation Model (SDTM). This Appendix, which is comprised of this document in conjunction with study-related files, identifies and describes the components highly recommended for an electronic submission of SDTM data. The study-related files associated with this appendix include an annotated CRF, representative

Heat Release Rates of Burning Items in Fires
firebid.umd.eduData are available for heat release rate vs. time for many items, see for example Babrauskas and Grayson (1992), SFPE (1995) and the data base in Bukowski et al. (1989). Furniture calorimeter and cone measurements are available, with data specifically for: Pools, liquid or plastic Cribs (regular array of sticks)
Lecture 5 Multiple Choice Models Part I –MNL, Nested Logit
bauer.uh.eduMNL Model –Application -PIM • Data –A.C.Nielsenscanner panel data –117 weeks: 65 for initialization, 52 for estimation –565 households: 300 selected randomly for estimation, remaining hh= holdout sample for validation –Data set for estimation: 30,966 shopping trips, 2,275 purchases in the category (liquid laundry detergent)

How to Use Excel to Analyze Survey Data
webcms.pima.govJan 18, 2011 · the filtered data, then copy and paste it to another worksheet. ... •This might be based on reporting requirements from a funder. •It might also be based on your logic model –what outputs and outcomes you decided were important to ... • A two-variable data table (cross-tabulation) A Faster Way to Get Frequencies. Were staff helpful when ...

Kindergarten through Grade 12
www.nj.govScientific investigations produce data that must be analyzed in order to derive meaning. Because data patterns and trends are not always obvious, scientists use a range of tools—including tabulation, graphical interpretation, visualization, and statistical analysis—to identify the significant features and patterns in the data.

A Guide to the ADaM Basic Data Structure for Dataset …
www.pharmasug.orgFor the purposes of this paper, all data values in Study Data Tabulation Model (SDTM) datasets are considered to be observed. This is despite the fact that in actuality a data value may have been derived prior to or during the creation of the SDTM datasets. For example, an SDTM value of LDL cholesterol derived by the Friedewald calculation from
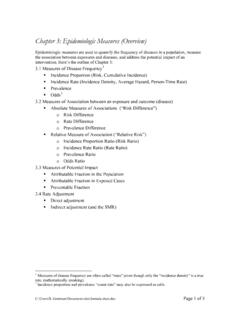
Chapter 3: Epidemiologic Measures (Overview)
www.sjsu.edu2-by-2 Cross-Tabulation of Count Data (Incidence Proportions and Prevalences only) D+ : ... the multivariate model that best suits the type of data (e.g. dichotomous vs. continuous) you collected and the design you employed (e.g. case-control vs. cohort). VI. Do not adjust for covariates that may be intermediate causes (on the causal pathway ...

Title stata.com logit — Logistic regression, reporting ...
www.stata.comTitle stata.com logit — Logistic regression, reporting coefficients DescriptionQuick startMenuSyntax OptionsRemarks and examplesStored resultsMethods and formulas ReferencesAlso see Description logit fits a logit model for a binary response by maximum likelihood; it models the probability

Title stata.com ologit — Ordered logistic regression
www.stata.comchi-squared test is not directional. One way to model these data is to model the categorization that took place when the data were created. Cars have a true frequency of repair, which we will assume is given by S j = foreign j + u j, and a car is categorized as “poor” if S j …