Nonlinear Functions - UH
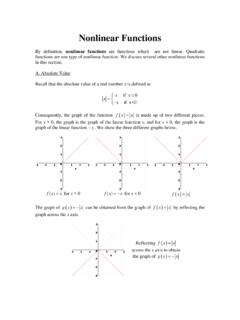
For x > 0, the graph is the graph of the linear function x, and for x < 0, the graph is the graph of the linear function −x. We show the three different graphs below. f ()xx= for x > 0 ( )f xx=− for x < 0 f ()xx= The graph of gx x()=− can be obtained from the graph of f (xx)= by reflecting the graph across the x axis. Reflecting f (xx)=
Download Nonlinear Functions - UH

Information
Domain:
Source:
Link to this page:
Documents from same domain

Lecture notes Math 4377/6308 { Advanced Linear …
www.math.uh.eduLecture notes Math 4377/6308 { Advanced Linear Algebra I Vaughn Climenhaga October 7, 2013

Lecture notes Math 4377/6308 { Advanced Linear …
www.math.uh.eduLecture notes Math 4377/6308 { Advanced Linear Algebra I Vaughn Climenhaga December 3, 2013

Section 3.2 Solving Systems of Linear Equations Using Matrices
www.math.uh.eduSection 3.2 – Solving Systems of Linear Equations Using Matrices 1. Section 3.2 Solving Systems of Linear Equations Using Matrices . In Section 1.3 we solved 2X2 systems of linear equations using either the substitution or

Test 2 Review - UH
www.math.uh.eduJiwen He, University of Houston Math 1431 – Section 24076, Test 2 Review October 28, 2008 32 / 69 Section 4.7 Vertical Aymptotes: Rational Function The line x = 4 is a vertical asymptote for

1 Definition and Properties of the Exp Function - UH
www.math.uh.edu1 Definition and Properties of the Exp Function 1.1 Definition of the Exp Function Number e Definition 1. The number e is defined by ... ∀x > 0, E L = elnx = x. • ∀x > 0, y = lnx ⇔ ey = x. • graph(ex) is the reflection of graph(lnx) by line y = x. ... eudu = eu +C = eg(x) +C.

Jiwen He 1.1 Geometric Series and Variations
www.math.uh.eduVariations on the Geometric Series (II) Closed forms for many power series can be found by relating the series to the geometric series Examples 2.
Chapter 3 Second Order Linear Differential Equations
www.math.uh.edusecond order linear differential equation: a second or- der, linear differential equation is an equation which can be written in the form y 00 + p ( x ) y 0 + q ( x ) y = f ( x ) (1)
Second Order Linear Differential Equations - UH
www.math.uh.eduSecond Order Linear Differential Equations ... This chapter is concerned with special yet very important second order equations, namely linear equations. Recall that a first order linear differential equation is an equation which can be written in the form y0 + p(x)y= q(x)

Introduction to Real Analysis Fall 2014 Lecture Notes
www.math.uh.eduChapter 1 Metric Spaces These notes accompany the Fall 2011 Introduction to Real Analysis course 1.1 De nition and Examples De nition 1.1. Given a set X a metric on X is a function d: X X!R

Introduction to Real Analysis Spring 2014 Lecture Notes
www.math.uh.eduChapter 1 Sequences and Series of Functions In this chapter we introduce di erent notions of convergence for sequence and series of functions and then examine how integrals and derivatives be-
Related documents
XXXXXXXXXXXXXXX X XXXXXXXXXXXXXXXXXXXXX ...
portal.ct.gov28263 d p:5 t:281 60151 1 av 0.376 xxxxxxxxxxxxxxx x xxxxxxxxxxxxxxxxxxxxx xxxxxxxxxxxxxxx x xxxxxxxxxxxxxxxxxxxxx xxxxxxxxxxxxxxxxxxxxxxxxxxxxxx
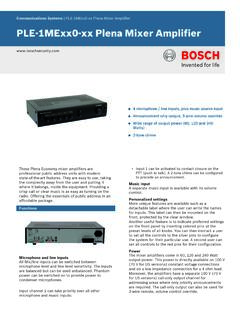
PLE‑1MExx0‑xx Plena Mixer Amplifier
resources-boschsecurity-cdn.azureedge.netMax / rated PLE-1ME240‑xx 360 W / 240 W Loudspeaker output 4 ohm Connector Screw terminal, floating PLE-1ME060-xx 15.5 V (60 W) PLE-1ME120-xx 22 V (120 W) PLE-1ME240-xx 31 V (240 W) Mechanical Dimensions (H x W x D) 100 x 430 x 270 mm (19" wide, 2U high) Mounting Stand-alone, 19" rack Color Charcoal Weight PLE-1ME060-xx Approx. 6.5 kg
nn) (cx ncx nn) - Lamar University
tutorial.math.lamar.eduCommon Derivatives and Integrals Visit http://tutorial.math.lamar.edu for a complete set of Calculus I & II notes. © 2005 Paul Dawkins Inverse Trig Functions 1
Part - A Section - I
vaga.study21xx2+−832 x− 7 =0 ()xx+−92() 3 =0 x = 15.o r−9 Thus (c) is correct option. (v) Perimeter of frame = Perimeter of Outside Rectangle = 21^h02++xx 52+ = 21^h54+ x = 21^h54+ #15. = 42 m Thus (b) is correct option. 18. Resident Welfare Association (RWA) of a Gulmohar Society in Delhi have installed three electric poles A,
Quadratic Least Square Regression
www.azdhs.govQuadratic Least Square Regression A nonlinear model is any model of the basic form in which the functional part of the model is not linear with respect to the
XX RR-6 58 57 56 55 54 53 52 49 48 47 46 44 ... - Geotechgolf
www.geotechgolf.comXX RR-6 58 57 56 55 54 53 52 49 48 47 46 44 43 42 40 38 37 36 35 33 32 30 xx-17 xx-16 X-15 X-14 x- 13 s- 12 s -11 s-10 RR-5 RR-4 . Created Date: