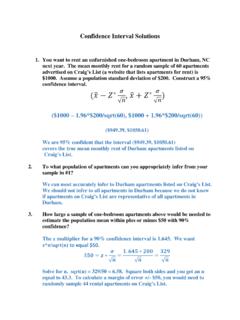
Normal Distribution, Confidence Intervals for the Mean ...
Use a 2-tailed probability of 0.05 (1 – 0.95). Again, we use the 2-tailed values since we are calculating confidence intervals that lie above and below the mean.
Download Normal Distribution, Confidence Intervals for the Mean ...
Information
Domain:
Source:
Link to this page:
Documents from same domain

What is ICT literacy, and why measure it?
webspace.ship.edu1 1 ICT Literacy Assessment Information and Communication Technology Educational Testing Service (ETS) Teresa Egan, Project Leader, New Product Development

FOUR FORCES Natural Selection Mutation Genetic …
webspace.ship.eduFOUR FORCES Natural Selection Mutation Genetic Drift Gene Flow NATURAL SELECTION Driving Force - DIRECTIONAL Acts on variation in population Therefore, most be VARIATION to begin with

Hydrology: additional unit conversion problems …
webspace.ship.eduHydrology: additional unit conversion problems (solutions) 1. You measure a 4.5-inch distance of stream channel on a 1:50,000 scale topographic map.

Change Your Teaching the Marie Clay Way!
webspace.ship.eduSequential Processing Everything we do in mature reading and writing will rely on fast accurate perception of language sounds (captured by the ears) and visual symbols

Introduction to Data Science - webspace.ship.edu
webspace.ship.eduFeature engineering is the process of using domain knowledge about data to create features that are used in machine learning algorithms. Imagine 442 teams of data

Use the CSE (Council of Science Editors) format, using the ...
webspace.ship.eduCSE (Council of Science Editors, formerly CBE, Council of Biology Editors). Many of these styles draw upon two standard methods of citing sources: the author-date method and the numerical-sequence method (similar to numbered footnotes or endnotes).

Research Paper Requirements
webspace.ship.eduGrade loss for not meeting this requirement: 5% per component 3. Paper Length Paper length refers to the total number of text pages, excluding all figures, graphics, maps, and references. The paper length listed in the syllabus refers to the minimum number of full pages that are required. Papers can exceed this minimum requirement by one or two ...
Testing for Normality - Shippensburg University
webspace.ship.eduKolmogorov-Smirnov a Shapiro-Wilk a. Lilliefors Significance Correction Normally Distributed Data Asthma Cases .069 72 .200* .988 72 .721 Statistic df Sig. Statistic df Sig. Kolmogorov-Smirnov a Shapiro-Wilk *. This is a lower bound of the true significance. a. …

Social Psychology Chapter 1 David Myers
webspace.ship.eduSocial Psychology Social Psychology - the study of how people think, influence, and relate to each other across different social situations –Applied Social Psychology –understanding what influences your life, your beliefs, your attitudes, and

Critical Values of the Spearman’s Ranked Correlation ...
webspace.ship.eduCritical Values of the Spearman’s Ranked Correlation Coefficient (r )s Taken from Zar, 1984 Table B.19. 20 rte rts 58 se sr so 18 n re n rs rr a o' o. 0 0 ' roo O ror 'ros o o o roe o o rro .rrr o rn o rre .rr8 o rso rsr 0. rStt .rse 0 no 0 ne o rtts ree rer rea o rss o o o o O sex 2sr o 200 .eoo o 20 ree o rao . ras o ratt ras raa
Related documents
Probability and Statistics Vocabulary List (Definitions ...
online.math.uh.edu• Confidence interval – an interval, calculated from a sample, which contains the value of a certain population parameter with a specified probability. • Confidence level - the probability that the statistician's confidence interval contains the true, unknown population parameter.
Calculating Standard Errors and Confidence Intervals
www.bls.govThe following are examples of confidence intervals: A 90% confidence interval is the range from 1.645 standard errors below the estimate to 1.645 standard errors above the estimate. The true population value is unknown, but there is an approximate 90% probability that the interval includes or “covers” the true population value.

Machine Learning Basics: Estimators, Bias and Variance
cedar.buffalo.eduprobability that true expectation falls in any chosen interval • Ex: 95% confidence interval centered on mean is • ML algorithm A is better than ML algorithm B if – upperbound of A is less than lower bound of B µˆ m µˆ m −1.96SEµˆ (m),µˆ m +1.96SEµˆ ((m))

Common types of clinical trial design, study objectives ...
www.ema.europa.eu• The p-value is the probability of this data (or more extreme) IF H 0 IS TRUE. ... Common types of clinical trial design, study objectives, randomisation and blinding, hypothesis testing, p-values and confidence intervals, sample size calculation
Confidence Interval Solutions - Duke University
sites.nicholas.duke.educonfidence interval is probably not the appropriate tool to make inferences about the true mean mpg. 6. True or False: The population mean (μ) is a random variable that will fall within a confidence interval with 95% probability (with repeated sampling). FALSE. The population mean is NOT a random variable but a population parameter.

Exam Questions - Confidence Intervals
www.toothillschool.co.ukState the probability that neither of these confidence intervals will contain u. (l mark) It is also proposed that, from a third random sample of 50 tubs, a 99% confidence interval for be constructed and that, from a fourth independent, random sample of 50 tubs, a 90% confidence interval for be constructed.

A Practical Guide for Interpreting Confidence Intervals
www.afit.eduFigure 4 shows 90% confidence intervals from samples of size 50. The intervals in . Figure 4 are more precise that the intervals in Figure 2, but have the same level of accuracy. The narrower intervals reflect the increased information from the larger sample. Sample Size for Confidence Intervals

Point-Biserial and Biserial Correlations
ncss-wpengine.netdna-ssl.comThis procedure calculates estimates, confidence intervals, and hypothesis tests for both the point-biserial and the biserial correlations. The point-biserial correlation is a special case of the product -moment correlation in which one variable is continuous and the …

Chapter 7: Statistical Analysis Data Treatment and Evaluation
web.iyte.edu.trFinding the confidence interval when is known or s is a good estimate of The confidence level (CL) is the probability that the true mean lies within a certain interval and is often expressed as a percentage. Figure 7-1c the confidence level is 90% and the confidence interval is from …