
One Sample t-Test
1 One Sample t-Test Purpose: One sample t-test is a statistical procedure often performed for testing the mean value of a distribution. It can be used under the assumption that sampled distribution is normal. For large samples, the procedure often performs well even for non-normal populations.
Download One Sample t-Test

Information
Domain:
Source:
Link to this page:
Documents from same domain
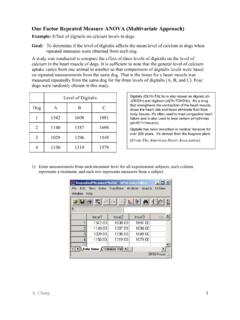
One Factor Repeated Measure ANOVA …
gchang.people.ysu.eduA. Chang 2 2) Click through the following sequence of options to perform repeated measures analysis. Analyze / General Linear Model / Repeated Measures …

Box Plot and Side-by-Side Box Plot
gchang.people.ysu.edu4.) View Plot. For side by side Box Plots step 1 is repeated. 2.) Enter Data in a column with 1 or 2 in the column next to it denoting month 1 and

Wilcoxon Signed Rank Test Purpose t
gchang.people.ysu.eduSPSS Note on Signed Rank Test Interpret SPSS Output: The statistics for the test are in the following table. For Two-sided test: The two-sided test p-value for Asymptotic 2-tailed test is .002 and for the Exact 2- tailed is 0.001. For one-sided test: The first table below shows that the negative mean rank is less than the positive mean rank. This suggests that the pulse rate measure from after ...

Hypothesis Testing for Proportions
gchang.people.ysu.eduHypothesis Testing for Proportions 1 HT - 1 Chapter 8 Tests of Statistical Hypotheses 8.1 Tests about Proportions HT - 2 Inference on Proportion Parameter: Population Proportion p (or π) (Percentage of people has no health insurance) Statistic: Sample Proportion n x pˆ = x is number of successes n is sample size Data: 1, 0, 1, 0, 0 .4 5 2 ...

Logistic Regression and Odds Ratio
gchang.people.ysu.eduLogistic Regression and Odds Ratio A. Chang 1 Odds Ratio Review Let p1 be the probability of success in row 1 (probability of Brain Tumor in row 1) 1 − p1 is the probability of not success in row 1 (probability of no Brain Tumor in row 1) Odd of getting disease for the people who were exposed to the risk factor: ( pˆ1 is an estimate of p1) O+ = Let p0 be the probability of success …

How to Use SPSS for Contingency Table, Relative Risk, Odds ...
gchang.people.ysu.eduContingency Table and Chi-square Test 1 How to Use SPSS for Contingency Table, Relative Risk, Odds Ratio and Chi-Square Test Example: Suppose we conducted a prospective cohort study to investigate the effect of aspirin on heart disease. A group of patients who are at risk for a heart attack are randomly assigned to either a placebo or aspirin.
Related documents
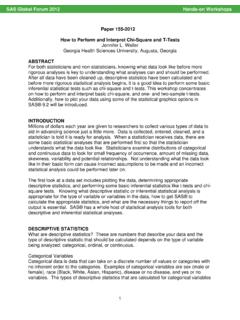
155-2012: How to Perform and Interpret Chi-Square and T …
support.sas.com! 1 Paper 155-2012 How to Perform and Interpret Chi-Square and T-Tests Jennifer L. Waller Georgia Health Sciences University, Augusta, Georgia ABSTRACT

T O aSe S G ASE Automobile Tests
www.ase.comae a UTOMOBILe TUDY gUIDe Page 3 oVerVIew Introduction The Official ASE Study Guide of Automobile Tests is designed to help technicians study for the ASE certification tests. It covers detailed information on the tech-

Basic Statistical Reporting for Articles Published in ...
www.equator-network.orgLang T, Altman D. Statistical Analyses and Methods in the Published Literature: the SAMPL Guidelines. 2 comprehensive—and comprehensible—set of

Statistical Inference and t-Tests - Minitab
www.minitab.comStatistical Inference and t-Tests - Minitab ... Test
Testing Group Difierences using T-tests, ANOVA, and ...
www.stat-help.comContents 1 Introduction 1 2 Testing One or two Means 5 3 Testing a Single Between-Subjects Factor 15 4 Testing Multiple Between-Subjects Factors 30

One and Two-sample t-tests - Columbia University
www.stat.columbia.eduOne and Two-sample t-tests The R function t.test() can be used to perform both one and two sample t-tests on vectors of data. The function contains a variety of options and can be called as follows:

Statistics: 1.1 Paired t-tests - www.statstutor.ac.uk
www.statstutor.ac.ukStatistics: 1.1 Paired t-tests Rosie Shier. 2004. 1 Introduction A paired t-test is used to compare two population means where you have two samples in