
Pearson’s correlation - statstutor
Pearson’s correlation Introduction Often several quantitative variables are measured on each member of a sample. If we consider a pair of such variables, it is frequently of interest to establish if there is a
Download Pearson’s correlation - statstutor

Information
Domain:
Source:
Link to this page:
Documents from same domain

Statistics: 1.1 Paired t-tests - www.statstutor.ac.uk
www.statstutor.ac.ukNOTE: Forthistesttobevalidthedifferencesonlyneedtobeapproximatelynormallydistributed. Therefore, it would not be advisable to use a paired t-test where there were ...
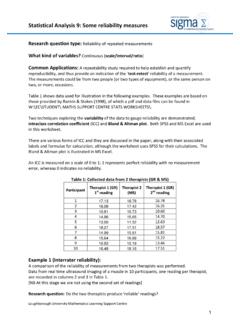
Statistical Analysis 9: Some reliability measures
www.statstutor.ac.uk1 Statistical Analysis 9: Some reliability measures Research question type: Reliability of repeated measurements What kind of variables? Continuous (scale/interval/ratio) ...

Statistical Analysis 5: Chi-squared ( 2) test for 2 …
www.statstutor.ac.uk4 Example 2: Research question: Is there a association between the proportion of defectives and the machine used? A sample of 200 components is selected from the output of a factory that uses three different machines to manufacture these components.
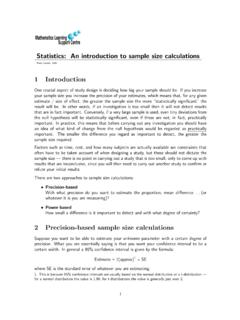
Statistics: An introduction to sample size calculations
www.statstutor.ac.ukStatistics: An introduction to sample size calculations Rosie Cornish. 2006. 1 Introduction One crucial aspect of study design is …
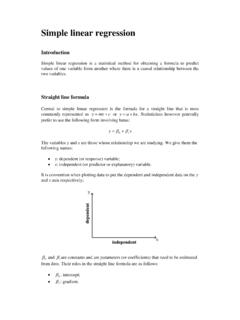
Simple linear regression - statstutor
www.statstutor.ac.ukSimple linear regression Introduction Simple linear regression is a statistical method for obtaining a formula to predict values of one variable from another where ...

Statistical Analysis 8: Two-way analysis of variance …
www.statstutor.ac.uk1 Statistical Analysis 8: Two-way analysis of variance (ANOVA) Research question type: Explaining a continuous variable with 2 categorical variables What kind of variables?

Statistical Methods 13 Sampling Techniques - statstutor
www.statstutor.ac.ukStatistical Methods 13 Sampling Techniques Based&on&materials&provided&by&Coventry&University&and& Loughborough&University&under&aNaonal&HE&STEM
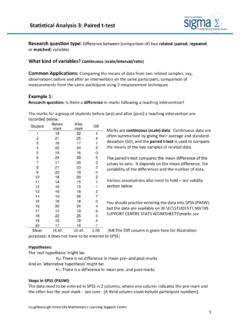
Statistical Analysis 3: Paired t-test - www.statstutor.ac.uk
www.statstutor.ac.uk3 If we were to do this experiment 100 times, 95 times the true value for the difference would lie in the 95% confidence interval. In our case, the 95% CI is from 0.7 to 3.4. This confirms that, although
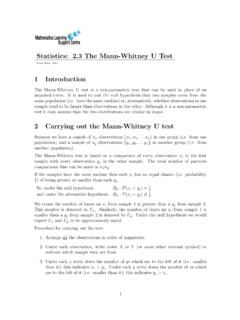
Statistics: 2.3 The Mann-Whitney U Test - statstutor
www.statstutor.ac.ukThe exact test and the normal approximation give similar results. We would conclude ... 3 Carrying out the Mann-Whitney U test in SPSS — Choose Analyze — Select Nonparametric Tests — Select 2 Independent Samples — Highlight your test variable (in our example this would be age) and click on the arrow
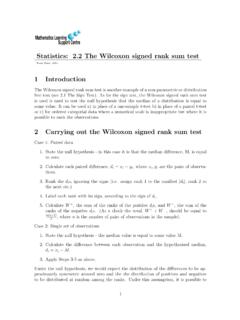
Statistics: 2.2 The Wilcoxon signed rank sum test
www.statstutor.ac.ukThe Wilcoxon signed rank sum test is another example of a non-parametric or distribution free test (see 2.1 The Sign Test). As for the sign test, the Wilcoxon signed rank sum test is used is used to test the null hypothesis that the median of a distribution is equal to some value. It can be used a) in place of a one-sample t-test b) in place of ...
Related documents

Two-way (between-groups) ANOVA - University of Sheffield
www.sheffield.ac.ukwww.statstutor.ac.uk University of Sheffield University of Worcester The results of the two-way ANOVA and post hoc tests are reported in the same way as one way ANOVA for the main effects and the interaction e.g. there was a statistically
Statistics: 2.2 The Wilcoxon signed rank sum test - statstutor
www.statstutor.ac.ukwork out the exact probability of every possible outcome for W. To carry out the test, we therefore proceed as follows: 6. Choose W = min(W−,W+). 7. Use tables of critical values for the Wilcoxon signed rank sum test to find the

ANCOVA (Analysis of Covariance) - University of Sheffield
www.sheffield.ac.ukwww.statstutor.ac.uk University of Sheffield Steps in SPSS To carry out an ANCOVA, select Analyze General Linear Model Univariate . Put the dependent variable (weight lost) in the . Dependent Variable. box and the independent variable (diet) in the . Fixed Factors. box. Proceed to put the covariates of interest (height) in the . Covariate(s) box.