
POPULATION COMPOSITION
population in the age group 0-14 from 41.2 to 38.1 per cent during 1971 to 1981 and 36.3 to 29.5 percent during 1991 to 2011, whereas, the proportion of economically active population (15-59 years) has increased from 53.4 to 56.3 percent during 1971 to 1981 and 57.7 to 62.5
Download POPULATION COMPOSITION

Information
Domain:
Source:
Link to this page:
Documents from same domain
Maternal & Child Mortality and Total Fertility Rates ...
censusindia.gov.inMaternal & Child Mortality and Total Fertility Rates Sample Registration System (SRS) Office of Registrar General, India 7th July 2011 • Sample Registration System (SRS) is designed for reliable
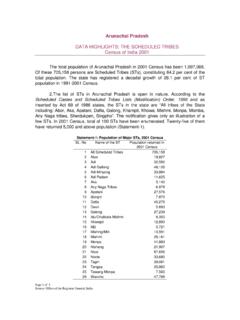
DATA HIGHLIGHTS: THE SCHEDULED TRIBES …
censusindia.gov.inPage 1 of 5 Source: Office of the Registrar General, India Arunachal Pradesh DATA HIGHLIGHTS: THE SCHEDULED TRIBES Census of India 2001 The total population of Arunachal Pradesh in 2001 Census has been 1,097,968.

ALPHABETICAL LIST OF TOWNS AND THEIR …
censusindia.gov.inList of towns: Census of India 2001 Karnataka – Page 1 of 9 ALPHABETICAL LIST OF TOWNS AND THEIR POPULATION
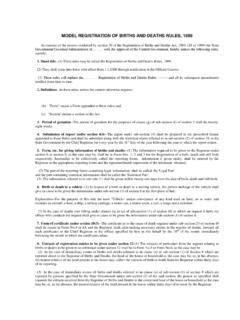
MODEL REGISTRATION OF BIRTHS AND DEATHS …
censusindia.gov.inMODEL REGISTRATION OF BIRTHS AND DEATHS RULES, 1999 In exercise of the powers conferred by section 30 of the Registration of Births and Deaths Act, 1969, (18 of 1969) the State
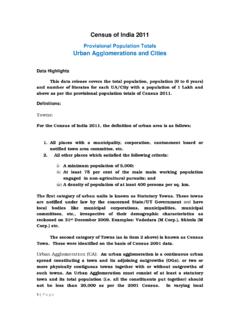
Provisional Population Totals Urban …
censusindia.gov.in1 | P a g e Census of India 2011 Provisional Population Totals Urban Agglomerations and Cities Data Highlights This data release covers the total population, population (0 to 6 years)
UP SC comments - 2011 Census of India
censusindia.gov.inPage 2 of 5 Source: Office of the Registrar General, India 2 Sex Ratio 6.The overall sex ratio of the SC population in Uttar Pradesh is 900
Introduction - Census of India Website
censusindia.gov.in1 The relevant Articles dealing with the Scheduled Castes (SCs) & Scheduled Tribes (STs) in the Constitution of India provide for as under : Scheduled Castes
JAMMU & KASHMIR - 2011 Census of India
censusindia.gov.inList of towns: Census of India 2001 Jammu & Kashmir – Page 1 of 3 ALPHABETICAL LIST OF TOWNS AND THEIR POPULATION
MAHARASHTRA - 2011 Census of India
censusindia.gov.inPage 2 of 4 Source: Office of the Registrar General, India Sex ratio 6. The sex ratio of the ST population in Maharashtra is 973 females per 1000 males,
Provisional Population Totals Paper 1 of 2011 India ...
censusindia.gov.inThe composition of population by gender is not uniform and shows diverse patterns across differ-ent countries of the world. Statement-11 and Figure
Related documents

FLORIDA POPULATION BY AGE GROUP - EDR
edr.state.fl.usSource: Florida Demographic Estimating Conference, February 2015 and the University of Florida, Bureau of Economic and Business Research, Florida …

2020 Mid-Year Population Estimates: Age and sex profile
www.kent.gov.ukfemales up to the age of 29 years. Beyond this age, there are more females than males, although the exact age at which there become more females than males does vary between each local authority district. • The mean age of the population in Kent is 41.4 years. This is a year older than the national mean age which is 40.3 years.
Poverty Among the Population Aged 65 and Older
sgp.fas.orgApr 14, 2021 · The poverty rate for the aged population historically was higher than the rates for younger groups, but the aged have experienced lower poverty rates than children under age 18 since 1974 and lower rates than adults aged 18-64 since the early 1990s.
The Population 65 Years and Older in the United States: 2016
www.census.govThe U.S. older population grew rapidly for most of the 20th century, from 3.1 million in 1900 to 35.0 million in 2000. Except during the 1990s, when the relatively smaller Depression Era cohort of the 1930s reached the age of 65, the growth of the population 65 and older surpassed that of the total population and the population under the age of ...
Age Adjustment Using the 2000 Projected U.S. Population
www.cdc.govage group is the size of the corresponding age group in the standard population divided by the total standard population for all ages of interest. Table 2 shows 22 different population age distributions used in calculating baseline data from various major data systems for the Healthy People 2010 objectives that use age adjustment.

2020 Excess Deaths in the U.S. General Population by Age ...
www.soa.orgStep 1: Create Expected Deaths for 2020 by Age and Sex: These expectations are based on U.S. CDC death information and U.S. Census Bureau population information from 2010 to 2019. These numbers are used to create prior year death rates. The projected death rates are multiplied by 2020 population estimates to determine expected 2020 deaths. The 2020

3. THE VETERAN POPULATION
www.va.gov3.2 Age Respondents were asked to give their birthdate. Age was then calculated from this information. The average age of all veterans was 58 years. More specifically, 21.1 percent of the veteran population was under the age of 45, 41.2 percent were between the ages of 45 and 64, and 37.1 percent of the population was 65 years or older.

Table 4. Projected Population, by Age Group, Sex, and by ...
psa.gov.phSource: Philippine Statistics Authority, 2010 Census-based Population Projections in collaboration with the Inter-Agency Working Group on Population Projections Projected Population, by Age Group, Sex, and by Single-Calendar Year Interval, Philippines: 2010 - 2020 (Medium Assumption) - continued

Australia to 2050 - Treasury
treasury.gov.auworking age. Australia’s population will continue to grow, though at slightly slower rates than over the past 40 years. This is an inevitable consequence of population trends evident for many decades. Sustainable population growth assists in managing the pressures of an ageing Long-term population trends