Regression with a Binary Dependent Variable - Chapter 9
Simply run the OLS regression with binary Y. I 1 expresses the change in probability that Y = 1 associated with a unit change in X1. ... Logit, or logistic regression, uses a slightly di erent functional form of the CDF (the logistic function) instead of the standard normal CDF.
Download Regression with a Binary Dependent Variable - Chapter 9

Information
Domain:
Source:
Link to this page:
Documents from same domain
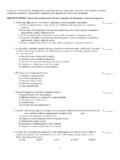
MULTIPLE CHOICE. Choose the one alternative that …
courses.umass.eduEconomics 103 Spring 2012: Multiple choice review questions for final exam. Exam will cover chapters on perfect competition, monopoly, monopolistic competition and oligopoly up to the Nash equilibrium

Elasticities of Demand and Supply: Today add elasticity ...
courses.umass.eduElasticities of Demand and Supply: Today add elasticity and slope, cross elasticities! Influences on the price elasticity of demand fall into two ... Price elasticity of demand for agricultural products (oranges) is 0.4. So if a frost cuts the supply of oranges (and demand
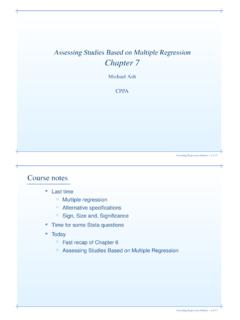
Assessing Studies Based on Multiple Regression Chapter 7
courses.umass.eduInternal Validity • Want βˆ to be unbiased and consistent estimator of β • Hypothesis tests should have the intended significance level and CI’s should have the desired confidence level.
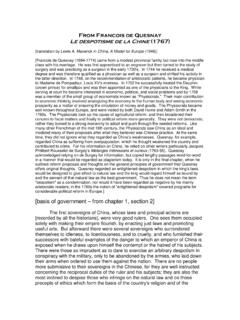
From Francois de Quesnay Le despotisme de la Chine (1767)
courses.umass.eduFrom Francois de Quesnay Le despotisme de la Chine (1767) [translation by Lewis A. Maverick in China, A Model for Europe (1946)] [Francois de Quesnay (1694-1774) came from a modest provincial family but rose into the middle
Comparing Means Between Groups - UMass
courses.umass.eduSummary of Main Points I Comparing means between groups is an important method for program evaluation by policy analysts and public administrators. I The question \Does a program work?" is often answered in terms of the program’s e ect on the mean of an important
BASIC CONCEPTS OF LOGIC - UMass
courses.umass.eduChapter 1: Basic Concepts 3 treats all of these things in terms of a single sort of thing – statements . Logic corre-spondingly treats inferences in terms of collections of statements, which are called
Fall 2012 Economics 103h: Review questions for final exam ...
courses.umass.eduFall 2012 Economics 103h: Review questions for final exam, part 2 . Below are the remaining questions on monopolistic competition and on oligopoly. Short answer/graphing questions on oligopoly (review questions part 1 had questions on monopolistic competition). 1. Draw on a graph and explain in words how firms collude to make monopoly profits. 2.
DERIVATIONS IN SENTENTIAL LOGIC - UMass
courses.umass.edutime (say, less than 100 years!) Another shortcoming of the truth-table method is that it does not require much in the way of reasoning. It is simply a matter of mechanically following a simple set of directions. Accordingly, this method does not afford much practice in …
BASIC CONCEPTS OF LOGIC - UMass
courses.umass.eduReasoning is a special mental activity called inferring, what can also be called making (or ... one conclusion-marker – the word ‘therefore’. Besides ‘therefore’, there are other ... correct either; they are just plain unreasonable. Suppose you flunk intro logic, and suppose that on the basis of this you conclude that it will be a ...
Regression with a Binary Dependent Variable - Chapter 9
courses.umass.eduLogit or Logistic Regression Logit, or logistic regression, uses a slightly di erent functional form of the CDF (the logistic function) instead of the standard normal CDF. The coe cients of the index can look di erent, but the probability results are usually very similar to the results from probit and from the LPM.
Related documents

Introduction to Binary Logistic Regression
wise.cgu.edu1990), we could use WEIGHT to predict SEX (coded male = 0, female = 1). An ordinary least squares regression analysis tells us that Predicted SEX = 2.081 - .01016 * (Body Weight) and r = -.649, t(188) = -11.542, p < .001. A naïve interpretation is that we have a great model. It is always a good idea to graph data to make sure models are ...

Using outreg2 to report regression output, descriptive ...
www.princeton.eduLinear regression The command outreg2 gives you the type of presentation you see in academic papers. It is important to notice that outreg2 is not a Stata command, it is a user-written procedure, and you need to install it by typing (only the first time)
Correlation and Regression - James Madison University
educ.jmu.eduNotes prepared by Pamela Peterson Drake 5 Correlation and Regression Simple regression 1. Regression is the analysis of the relation between one variable and some other variable(s), assuming a linear relation. Also referred to as least squares regression and ordinary least squares (OLS). A. YThe purpose is to explain the variation in a variable (that is, how a …
Getting Started in Fixed/Random Effects Models using R
www.princeton.eduOLS regression. Comparing OLS vs LSDV model; Each component of the factor variable (country) is absorbing the effects particular to each country. Predictor ; x1 ; was not significant in the OLS model, once controlling for differences across countries, x1;

Chapter 8: Regression with Lagged Explanatory Variables
personal.strath.ac.ukThe Regression Model with Lagged Explanatory Variables Yt = α + β0Xt + β1Xt-1 + ... + βqXt-q + et • Multiple regression model with current and past values (lags) of X used as explanatory variables. • q = lag length = lag order • OLS estimation can be carried out as in Chapters 4-6. • Statistical methods same as in Chapters 4-6. • Verbal interpretation same as in Chapter 6.
Lecture 9 Models for Censored and Truncated Data ...
www.bauer.uh.eduBiased regression when applying OLS to truncated data Truncated Regression •Given the normality assumption for εi, ML is easy to apply. -For each, εi = yi-xi’β, the likelihood contribution is f(εi). -But, we select sample only if yi<ci => we have to …

Classical Linear Regression Model: Assumptions and ...
www.quantsummaries.comOct 05, 2016 · 1 The Classical Linear Regression Model (CLRM) Let the column vector xk be the T observations on variable xk, k = 1; ;K, and assemble these data in an T K data matrix X.In most contexts, the first column of X is assumed to be a column of 1s: x1 = 2 6 6 6 4 1 1... 1 3 7 7 7 5 T 1 so that 1 is the constant term in the model. Let y be the T observations y1, , yT, and let " be …

TIME SERIES REGRESSION - University of Delaware
www1.udel.eduTable 4: Multiple Regression for Petroleum Data ii. After 1971 when X 1 = 1 the expected level is 1.083 + .868 = 1.951 million barrels. 1) The regression parameter (.8684) in this case gives the effect of the intervention on the level of imports. iii. But what about trends of …
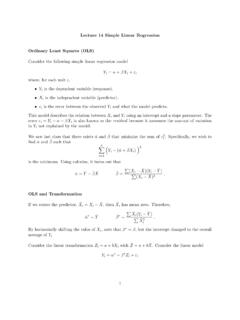
Lecture 14 Simple Linear Regression Ordinary Least Squares ...
www2.stat.duke.eduConsider the following simple linear regression model Y i = + X i + "i where, for each unit i, Y i is the dependent variable (response). X i is the independent variable (predictor). " ... Properties of OLS Given the estimates ^ and ^, we can de ne (1) the estimated predicted value Y^ i and (2) the estimated residual ^" i. Y^ i = ^ + X^ i "^ i ...