Repeated Measures ANOVA - Stony Brook
The ANOVA table ¦ k i SS B n i x i x 1 2 W B MS MS ¦ F k i MS B k n i x 1 2 1 1 ¦ ¦ k 1 i n j W ij i j SS x x 1 1 2 ¦ ¦k i n j W N k ij i j MS x x 1 1 2 k 1 N k Source S.S d.f, M.S. F Between Within The ANOVA table is a tool for displaying the computations for the F test. It is very important when the Between Sample variability is due to ...
Download Repeated Measures ANOVA - Stony Brook

Information
Domain:
Source:
Link to this page:
Documents from same domain
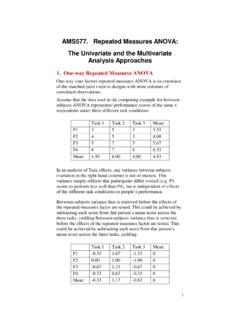
AMS577. Repeated Measures ANOVA: The …
www.ams.sunysb.edu1 AMS577. Repeated Measures ANOVA: The Univariate and the Multivariate Analysis Approaches 1. One-way Repeated Measures ANOVA One-way (one-factor) repeated-measures ANOVA is an extension
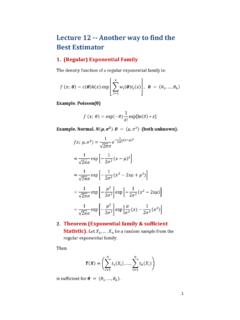
Lecture 12 -- Another way to find the Best Estimator
www.ams.sunysb.edu1 Lecture 12 -- Another way to find the Best Estimator 1. (Regular) Exponential Family The density function of a regular exponential family is:

Examples: Joint Densities and Joint Mass Functions
www.ams.sunysb.eduAMS 311 Joe Mitchell Examples: Joint Densities and Joint Mass Functions Example 1: X and Y are jointly continuous with joint pdf f(x,y) = ˆ cx2 + xy 3 if 0 ≤ x ≤ 1, 0 ≤ y ≤ 2

Chapter 3: The basic concepts of probability - Stony Brook
www.ams.sunysb.eduChapter 3: The basic concepts of probability Experiment: a measurement process that produces quantifiable results (e.g. throwing two dice, dealing cards, at poker, measuring heights of people, recording proton-proton collisions)
Vector Autoregression - Stony Brook
www.ams.sunysb.eduOverview Vector Autoregression (VAR) model is an extension of univariate autoregression model to multivariate time series data VAR model is a multi-equation system where all the variables are treated as endogenous (dependent) There is one equation for each variable as dependent variable. In its reduced form, the right-hand side of each
REGRESSION WITH TIME SERIES VARIABLES
www.ams.sunysb.edu•Regression modelling goal is complicated when the researcher uses time series data since an explanatory variable may influence a dependent variable with a time lag. This often necessitates the inclusion of lags of the explanatory variable in the regression. •If “time” is the unit of analysis we can still regress some dependent

Unit Root & Augmented Dickey-Fuller (ADF) Test
www.ams.sunysb.eduDickey-Fuller Tests • If a constant or trend belong in the equation we must also use D-F test stats that adjust for the impact on the distribution of the test statistic (* see problem set 3 where we included the drift/linear trend in the Augmented D-F test). • The D-F is generalized into the Augmented D-F test to accommodate the general

The Ordinary Least Squares (OLS) Estimator
www.ams.sunysb.eduGauss-Markov Theorem • Given OLS assumptions 1 through 6, the OLS estimator of β k is the minimum variance estimator from the set of all linear unbiased estimators of β

Solutions Manual for Statistical Inference, Second Edition
www.ams.sunysb.edusecond edition, problems were shuffled with no attention paid to numbering (hence no attention paid to minimize the new effort), but rather we tried to put the problems in logical order. A major change from the first edition is the use of the computer, both symbolically through Mathematicatm and numerically using R. Some solutions are given ...
Related documents

One-Way ANOVA Exam Practice - Discovering Statistics
www.discoveringstatistics.comC8057 (Research Methods II): One-Way ANOVA Exam Practice Dr. Andy Field Page 6 4/18/2007 ANOVA Serotonin Level 151.749 3 50.583 10.588 .000 109.881 23 4.777 261.630 26 Between Groups Within Groups Total Sum of Squares df Mean Square F Sig. Contrasts could be (weights in brackets):

How to interpret an ANOVA table - ConsultGLP
consultglp.comFor the one-way ANOVA in the table 1, the total number of data points is N and the number of groups of data is k. The total number of degrees of freedom is N – 1, just as for a simple data set of size N. There are k different groups and therefore, k – 1 …

ANOVA – Analysis of Variance - University of Edinburgh
homepages.inf.ed.ac.ukANOVA as Regression • It is important to understand that regression and ANOVA are identical approaches except for the nature of the explanatory variables (IVs). • For example, it is a small step from having three levels of a shade factor (say light, medium and heavy shade cloths) then carrying out a one-way analysis of variance, to
Understanding the One-way ANOVA - Northern Arizona …
oak.ucc.nau.eduThe ANOVA F test (named after Sir Ronald A. Fisher) evaluates whether the group means on the dependent variable differ significantly from each other. That is, an overall analysis-of-variance test is conducted to assess whether means on a dependent variable
REPEATED MEASURES (ANOVA)
oak.ucc.nau.eduRM ANOVA Page 3 The alternative univariate tests take into account violations of the sphericity assumption. These tests employ the same calculated F statistic as the standard univariate test, but its associated p value potentially differs. In determining the p value, an epsilon statistic is calculated based on the sample data to assess the degree that the sphericity
Lecture 7: Hypothesis Testing and ANOVA
www.gs.washington.eduOne-Way ANOVA •Simplest case is for One-Way (Single Factor) ANOVA The outcome variable is the variable you’re comparing The factor variable is the categorical variable being used to define the groups-We will assume k samples (groups) The one-way is because each value is classified in exactly one way •ANOVA easily generalizes to more factors
ANOVA Examples STAT 314 - people.vcu.edu
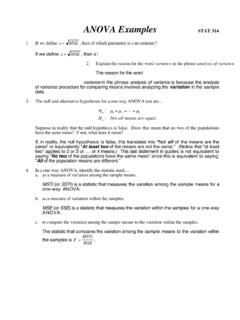
www.people.vcu.eduANOVA Examples STAT 314 1. If we define s = MSE, then of which parameter is s an estimate? If we define s = MSE, then s i s a n e s t i m a t e o f t h e common population standard deviation, σ, of the populations under consideration.(This presumes, of course, that the equal-standard-deviations assumption holds.) 2. Explain the reason for the word variance in the phrase …

Two-way (between-groups) ANOVA - University of Sheffield
www.sheffield.ac.ukThe results of the two-way ANOVA and post hoc tests are reported in the same way as one way ANOVA for the main effects and the interaction e.g. there was a statistically significant interaction between the effects of Diet and Gender on weight loss