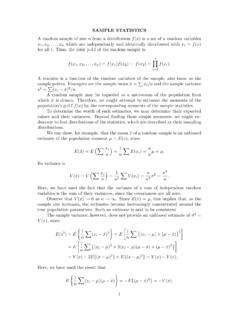
SAMPLE STATISTICS
sample points. Examples are the sample mean ¯x = x i/n and the sample variance s2 = (x i − ¯x)2/n A random sample may be regarded as a microcosm of the population from which it is drawn. Therefore, we might attempt to estimate the moments of the population’s p.d.f f(x) by the corresponding moments of the sample statistics.
Download SAMPLE STATISTICS

Information
Domain:
Source:
Link to this page:
Documents from same domain

230487 02c-063-102 18/10/09 10:16 Page 63 THE …
www.le.ac.ukTHE EXCAVATION OF A ROMAN CEMETERY AT 21 –33 NEWARKE STREET 69 The alignment of the ditches is at variance with that of the Roman town street plan …
LATE MESOLITHIC AND BEAKER ASSEMBLAGES …
www.le.ac.ukTrans. Leicestershire Archaeol. and Hist. Soc., (2012) LATE MESOLITHIC AND BEAKER ASSEMBLAGES FROM EXCAVATIONS AT LOUGHBOROUGH ROAD, ASFORDBY …

consistent. Observe that Themean ¯ x V ,x x i x
www.le.ac.ukA random sample x 1,x 2 ... variate are E (u)= n and V (u)=2 n respectively. Theorem. The sum of two independent chi-square variates is a chi-square variate with degrees of freedom equal to the sum of the degrees of freedom of its additive components. If x
Related documents

Reporting Statistics in Psychology
www.evc-cit.infoReport degrees of freedom in parentheses. The statistics t, p and Cohen’s d should be re-ported and italicised. One-sample t-test One-sample t-test indicated that femininity preferences were greater than the chance level of 3.5 for female faces (M = 4.50, SD = 0.70), t(30) = 8.01, p …
Statistics: An introduction to sample size calculations
www.statstutor.ac.ukStatistics: An introduction to sample size calculations Rosie Cornish. 2006. 1 Introduction One crucial aspect of study design is deciding how big your sample should be. If you increase your sample size you increase the precision of your estimates, which means that, for any given estimate / size of effect, the greater the sample size the more ...
STATISTICS 8 CHAPTERS 1 TO 6, SAMPLE MULTIPLE CHOICE …
www.ics.uci.eduSTATISTICS 8 CHAPTERS 1 TO 6, SAMPLE MULTIPLE CHOICE QUESTIONS Correct answers are in bold italics.. This scenario applies to Questions 1 and 2: A study was done to compare the lung capacity of coal miners to the lung capacity of farm workers. The researcher studied 200 workers of each type.

STATISTICS 8: CHAPTERS 7 TO 10, SAMPLE MULTIPLE …
www.ics.uci.eduSTATISTICS 8: CHAPTERS 7 TO 10, SAMPLE MULTIPLE CHOICE QUESTIONS 1. If two events (both with probability greater than 0) are mutually exclusive, then: A. They also must be independent. B. They also could be independent. C. They cannot be independent. 2. If two events (both with probability greater than 0) are mutually exclusive, then: A.

Alphabetical Statistical Symbols - Statistics.com: Data ...
www.statistics.com100+ online courses in statistics Symbol Text Equivalent Meaning Formula Link to Glossary (if appropriate) SD Sample standard deviation 1 ( )2 ¦ n x x s for ungrouped data. 1 ( )2 ¦ ¦ f f x x s for grouped data. sk b Bowley’s coefficient of skewness sk b = ( )) ( ) 3 1 (3 2 2 1 Q Q Measures of skew ness sk p Pearson’s coefficient of ...
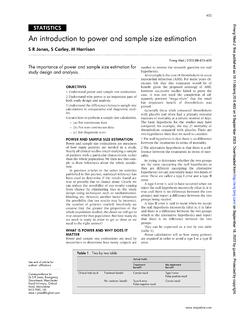
STATISTICS An introduction to power and sample size …
emj.bmj.comSTATISTICS An introduction to power and sample size estimation S R Jones, S Carley, M Harrison..... Emerg Med J2003;20:453–458 The importance of power and sample size estimation for study design and analysis..... OBJECTIVES 1 Understand power and sample size estimation. 2 Understand why power is an important part of both study design and ...
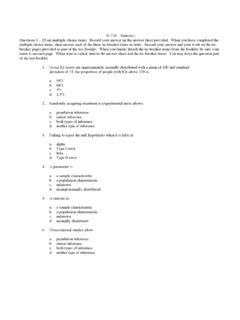
ACTM – Statistics
uca.edu10. Using the data in question 7, calculate number of observations that are two or more sample standard deviations from the sample mean. a. 0 b. 1 c. 2 d. 3 11. The data in question 7 appears to be reasonably symmetric. a. True b. False 12. When asked questions concerning personal hygiene, people commonly lie. This is an example of: a. sampling ...

Sample Statistics Exam #500 - California State University ...
www.csun.eduSample Statistics Exam #500 Multiple Choice Identify the letter of the choice that best completes the statement or answers the question. 1. Which is the following is correct? ... The mean of a sample of 20 from population A has a larger standard deviation than the mean of a sample of 20 from population B.

BASIC STATISTICS Random Sample. - Iowa State University
www2.econ.iastate.eduBASIC STATISTICS 5 VarX= σ2 X = EX 2 − (EX)2 = EX2 − µ2 X (22) ⇒ EX2 = σ2 X − µ 2 X 2.4. Unbiased Statistics. We say that a statistic T(X)is an unbiased statistic for the parameter θ of theunderlying probabilitydistributionifET(X)=θ.Giventhisdefinition,X¯ isanunbiasedstatistic for µ,and S2 is an unbiased statisticfor σ2 in a random sample. 3.