Stata: Visualizing Regression Models Using coefplot
Stata command for graphing results of Stata estimation commands user‐written ‐author: Ben Jann, University of Bern default behavior ‐plots markers for coefficients and horizontal spikes for confidence intervals features ‐results from multiple models can be displayed on a single graph
Download Stata: Visualizing Regression Models Using coefplot

Information
Domain:
Source:
Link to this page:
Documents from same domain

Amelia multiple imputation in R - opr.princeton.edu
opr.princeton.eduAmelia I and II Amelia is an R package that has had two major revisions. It was originally developed by Gary King, James Honaker, Anne Joseph, and Kenneth Scheve in 2001:

Introduction to ggplot2 - Office of Population Research
opr.princeton.eduIntroduction to ggplot2 Dawn Koffman Office of Population Research Princeton University January 2014 . 2 Part 1: Concepts and Terminology . R Package: ggplot2 Used to produce statistical graphics, author = Hadley Wickham "attempt to take the good things about base and lattice graphics
Interpreting and Visualizing Regression models with Stata ...
opr.princeton.eduInterpreting regression models • Often regression results are presented in a table format, which makes it hard for interpreting effects of interactions, of categorical variables or effects in a non-linear models. • For nonlinear models, such as logistic regression, the raw coefficients are often not of much interest.
Related documents

Documentation of Mandated Discharge Summary …
www.ahrq.govAnalyses were performed using SAS® version 9.1 and Stata® version 9.0. All confidence intervals (CI) and significance tests were significant at P < 0.05. The kappa statistic and percent agreements were calculated to measure abstraction reliability. 17, 18 . Results . Discharge Summary Characteristics and Joint Commission Component Definitions
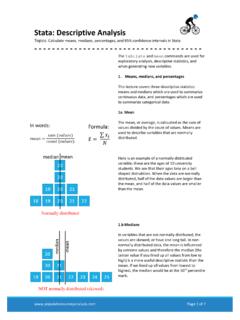
Stata: Descriptive Analysis
populationsurveyanalysis.comThe 95% confidence internval would be the spread of the middle 95 means. The 95% confidence interval represents a range of values that we are almost certain contains the real mean in the population. 2b. How to analyze skewed continous values Stata calculates 95% confidnece intervals for means and percentages. Stata will assume that any