STATISTICAL ANALYSIS 101
2 Groups Pre-test / Post-test - t-test-Mann-Whitney U test-Wilcoxen - Chi-Squared > 2 Groups-ANOVA -ANCOVA - MANOVA Pre-test / Post-test-RM-ANOVA Examine relationships Correlation Statistic - Pearson’s r Spearman Rho Kendall’s Tau-Chi Square Predict relationships Regression Analysis - Linear Regression - Multiple regression - Logistic ...
Download STATISTICAL ANALYSIS 101

Information
Domain:
Source:
Link to this page:
Documents from same domain

Slide Notes Billing Case Management - Learning …
admin.abcsignup.comSlide 19: For more information about Targeted Case Management (TCM) you may also reference the case management requirements for billing Medicaid on the Texas Medicaid & Healthcare Partnership

I. Joint Planning - Learning Stream
admin.abcsignup.comThe Texas ECI Coaching Checklist was developed based on information from Rush, D. & Shelden, M. (2005). Evidence-based definition of coaching practices.

PowerPoint Presentation
admin.abcsignup.comOrgan Failure: respiratory, renal, liver, heart failure ... Geriatric syndromes and related prognostic factors ... Geriatric Failure to Thrive: +Age >= 75, albumin < 3.5 g/dL, dependency in >=2 ADLs, admission to an acute care hospital or skilled nursing facility and 1 or more of conditions

ADP Workforce Now Essential Time & Attendance …
admin.abcsignup.comESSENTIAL TIME & ATTENDANCE SUPERVISOR BASICS FOR ADP WORKFORCE NOW HANDOUT MANUAL 2012 ADP, Inc. 2 V10011280337WFN41 Course Purpose This course prepares you to use ADP Workforce Now® to edit timecards, fix timecard

Using the Recruitment Feature - admin.abcsignup.com
admin.abcsignup.comUsing the Recruitment Feature in ADP Workforce Now Module 1: Creating and Posting Requisitions Handout Manual

Managing Your Basic General Ledger Interface Tasks
admin.abcsignup.comThe General Ledger Interface Process Overview General Ledger Interface (GLI) is an Internet product that resides on a safe and secure website. It converts ADP payroll data to a general ledger (G/L) file for import into your accounting software. General Ledger Interface streamlines the process of creating payroll journal entries and updating
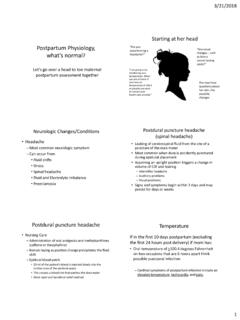
Postpartum Physiology, what’s normal
admin.abcsignup.comPulse: Rapid or increasing pulse rate can indicate hypovolemia Respirations: Return to pre-pregnancy rate soon after birth Respirations: Hypoventilation can be a result of an unusually high spinal block or epidural medication after a cesarean section Blood Pressure : Slight transient return of approx. 5% increase over the first

Medication Aide Skills Assessment Review Guide
admin.abcsignup.comsame time). Accurate within 4mm HG *** Critical Step 14. When sounds are no longer heard, open the valve completely and allow the cuff to completely deflate and remove it from the resident’s arm. 15. If need to retake the BP, allow one minute before re-inflating the cuff. 16. Position the resident. 17. Open the room. 18.

ADP Workforce Now® Managing Time Off (PTO) Demonstration
admin.abcsignup.com3 Scenario - Hourly Employees • Hourly employees receive a flat amount of hours upon new hire depending on the month they are hired • On an annual basis the amount of paid vacation an

ADP Workforce Now Pay - admin.abcsignup.com
admin.abcsignup.comAutomatic Pay calculates standard pay for salaried employees and for hourly employees with standard hours. You must enter paydata manually if there is …
Related documents
PEARSON’S VERSUS SPEARMAN’S AND KENDALL’S …
d-scholarship.pitt.eduaspects of monotone association and a interpreted differentlyare in statistical analysis. In this work, I focus on three popular indices that are often provided next to each other by standard software packages (e.g. Proc Corr, SAS v.9.2), namely the Pearson product moment correlation,

Pearson’s correlation - www.statstutor.ac.uk
statstutor.ac.ukCorrelation coefficient Pearson’s correlation coefficient is a statistical measure of the strength of a linear relationship between paired data. In a sample it is denoted by r and is by design constrained as follows Furthermore: Positive values denote positive linear correlation;
Statistical Data Analysis - Sherry Towers
www.sherrytowers.com4.7 Pearson 's X2 test 61 5 General concepts of parameter estimation 64 5.1 Samples, estimators, bias 64 5.2 Estimators for mean, variance, covariance 66 6 The method of maximum likelihood 70 6.1 ML estimators 70 6.2 Example of an ML estimator: an exponential distribution 72 6.3 Example of ML estimators: J..L and 0-2 of a Gaussian 74

Statistical Analysis 2: Pearson Correlation
www.statstutor.ac.ukPearson's correlation coefficient has a value between -1 (perfect negative correlation) and 1 (perfect positive correlation). If no underlying straight line can be perceived, there is no point going on to the next calculation. Step 2: Calculating the correlation coefficient With the data in the Data Editor, choose Analyze > Correlate > Bivariate…

Sample Size Guideline for Correlation Analysis
core.ac.ukCorrelation analysis is a common statistical analysis in various fields. The aim is usually to determine to what extent two numerical variables are correlated with each other. One of the issues that are important to be considered before conducting any correlation analysis is to plan for the sufficient sample size.
Pearson Edexcel Level 3 Advanced Subsidiary and Advanced ...
qualifications.pearson.com2 AS Level in Statistics 2 3 A Level in Statistics 4 4 Statistical Tables 8 able 1: Cumulative Binomial Distribution FunctionT 8 Table 2: Cumulative Poisson Distribution Function 15 Table 3: Normal Distribution Function 17 Table 4: Percentage Points of the Normal Distribution 18 Table 5: Percentage Points of the Student’s t-distribution 19
Correlation and Regression Analysis - OIC-StatCom
www.oicstatcom.orgappropriate statistical analysis. Also this textbook intends to practice data of labor force survey year 2015, second quarter (April, May, June), in Egypt by identifying how to apply correlation and regression statistical data analysis techniques to investigate the variables affecting phenomenon of employment and unemployment.

Statistical Analysis Handbook - StatsRef
www.statsref.com8.7.2 Monte Carlo Markov Chains (MCMC) 264 9 Correlation and autocorrelation 269 9.1 Pearson (Product moment) correlation 271 9.2 Rank correlation 280 9.3 Canonical correlation 284 9.4 Autocorrelation 286 9.4.1 Temporal autocorrelation 287 9.4.2 Spatial autocorrelation 292 10 Probability distributions 314 10.1 Discrete Distributions 319