
Statistical Process Control (SPC) - nutek-us.com
R. Roy/Nutek, Inc. Statistical Process Control – Management Overview Version 0509 Mean of the data is obtained by simply adding all data and dividing by the total number of data. _ Mean or Average X = ( 6 + 3 + 5 + 4 + 9 + 6 + 11 ) / 7 = 6.285 Median . R. Roy/Nutek, Inc. Statistical Process Control – Management Overview Version 0509 ...
Download Statistical Process Control (SPC) - nutek-us.com

Information
Domain:
Source:
Link to this page:
Documents from same domain

DOE-I Basic Design of Experiments - nutek-us.com
nutek-us.comComplimentary Copy: DOE-I Basic Design of Experiments (The Taguchi Approach) Nutek, Inc. Quality Engineering Seminar and Software
Design of Experiments (DOE) Using the Taguchi …
nutek-us.comNutek, Inc.Bloomfield Hills, MI. USA. Tel: 1-248-540-4827 Support@Nutek-us.com www.Nutek-us.com 0607 Page 4 TAGUCHI METHOD REVIEW APPLICATION STEPS

SAMPLE PMP PREPARATORY QUESTIONS AND …
nutek-us.comSAMPLE PMP PREPARATORY QUESTIONS AND ANSWERS 160 Free PMP Exam Prep Questions (Obtained from PM Connection: http://www.pmconnection.com/modules.php?name=Web_Links&l_op=viewlink&cid=9 )

A Walk-Through Taguchi Design of Experiment …
nutek-us.com1 A Walk-Through Taguchi Design of Experiment (DOE) Application | 8/1/2008 A Walk-Through Taguchi Design of Experiment (DOE) Application [Example: Plastic Injection Molding Process Study]

Quality Operating System – Overview - nutek-us.com
nutek-us.comQuality Operating System – Overview Predict Downstream Performance Track Trends of Measurable Select Internal Key Processes and Events Identify
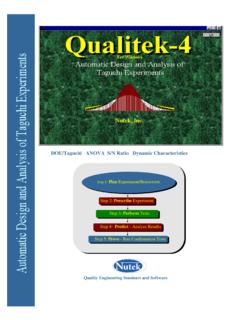
DOE/Taguchi ANOVA S/N Ratio Dynamic Characteristics
nutek-us.comA N O V A sta tistic s in te rm s o f r e la tiv e fa c to r in flu e n c e to th e v aria tio n o f re su lts a re sh o w n in p a re to iz e d B a r G ra p h a n d e x p lo d e d P ie d ia g ra m .
Related documents
I Sixth Edition ntroduction to - Sharif
ie.sharif.eduPart III contains four chapters covering the basic methods of statistical process control (SPC) and methods for process capability analysis. Even though several SPC problem-solving tools are discussed (including Pareto charts and cause-and-effect diagrams, for example), the primary focus in this section is on the Shewhart control chart.

USING A DECISION-MAKING PROCESS MODEL IN …
www.managementgeneral.roprocess includes three stages: identification, building decision components and implementation, which are shortly presented in Figure no. 3. (statistical, Figure no. 3. Decision-making process in 3 steps Identification: managers gather data within the organization; they apply mathematical and statistical methods on data gathered and use the
Statistical Analysis Plan (SAP) - ClinicalTrials.gov
clinicaltrials.govstatistical analysis. The subsections below will describe analyses in addition to the descriptive statistics. 6.1 Primary outcome The primary analysis will compare intervention groups (water supplementation vs control treatment) on their mean change in fasting plasma glucose between baseline and 12 months using a linear mixed model.
Introduction to Statistical Quality Control
support.sas.comIntroduction to Statistical Quality Control, Seventh Edition by Douglas C. Montgomery, which we refer to as ISQC throughout this book. However, the main emphasis of this book is on statistical process control and capability analysis. Therefore, we focus on the techniques provided in ISQC Part 3, “Basic Methods of Statistical

Continuous Process Verification - European Medicines Agency
www.ema.europa.euwith process data. • Watch and be alerted for batches deviating from ‘golden batch’. • React. • Charting data using SPC tools. • Apply analytical rules e.g., Western Electric rules to interpret charts. • Use totality of process knowledge to ‘correct’ process if alerted 15

NHS England » An overview of statistical process control
www.england.nhs.uk• Results in an unstable – OUT OF CONTROL – process because variation is not predictable • Is due to non-random or assignable causes of variation (i.e. a signal that the process has ‘changed’) Control Charts vs. Run Charts Run charts have traditionally been used in service improvement to measure changes in a process over time.

Process Improvement using DMAIC Approach: Case Study in ...
www.ijert.org(Define–Measure-Analyze–Improve–Control). It is the classic Six Sigma problem solving process. ... statistical analysis tools available such as ANOVA, Regression Analysis, EVOP, Process Capability Study, Pareto Analysis, etc. This paper presents the process improvement using the DMAIC approach, as the DMAIC proved to be the most preferred ...

Understanding Statistical Process Control (SPC) Charts
www.skillsdevelopmentnetwork.comIf the process is stable and predicable any variation is known as ‘common cause variation’. A process is ‘in control’ if it only displays common cause variation. Special cause If the process is unstable or ‘out of control’ any variation is known as ‘special cause variation’. This means that it is not an inherent part of the process.