
t-Test Statistics
1 t-Test Statistics Overview of Statistical Tests Assumption: Testing for Normality The Student’s t-distribution Inference about one mean (one sample t-test) Inference about two means (two sample t-test) Assumption: F-test for Variance Student’s t-test - For homogeneous variances
Download t-Test Statistics

Information
Domain:
Source:
Link to this page:
Documents from same domain
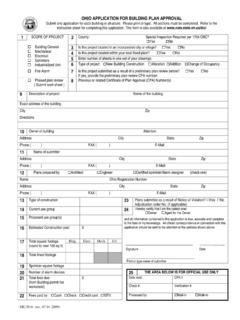
OHIO APPLICATION FOR BUILDING PLAN APPROVAL
www.ohio.edu5. Enter the number of sheets included in one set of your drawings. 6. Refer to Ohio Building Code (OBC) Chapter 2 for definitions. 7. If this project is submitted as a continuation of a preliminary plan review before, please provide the CPA number for

Academic Calendar 2018-19 - ohio.edu
www.ohio.eduAcademic Calendar 2018-19 Office of the University Registrar Office of the University Registrar Chubb Hall, First Floor 1 Ohio University Athens, OH 45701-2979

A Brief Review of Matrices and Linear Algebra - ohio.edu
www.ohio.eduMatrices are used in velocity, acceleration, and dynamics linear equations (matrices are not used in analytical position analysis, which requires a non-linear solution). 4 Special Matrices These are demonstrated for 3x3 matrices, but apply to all matrix sizes.

Bicycle Owner’s Manual - ohio.edu
www.ohio.eduBicycle Owner’s Manual Even if you have ridden a bike for years, it is important for EVERY person to read Chapter 1 before you ride your new bicycle.

Combined Heat Power - ohio.edu
www.ohio.eduCombined Heat and Power The coproduction of electricity and useful thermal energy from the same fuel source designed to achieve thermal‐efficiency levels of at least sixty per cent, with at least ...

NOISE CONTROL AND HEARING CONSERVATION PROGRAM …
www.ohio.edu5.1 Hearing protection selected must reduce noise levels to below acceptable noise exposure limits. If questions arise in the selection process, the Environmental Health and Safety Department should be contacted. 5.1.1 Ear muffs or plugs are acceptable if required noise reductions can be achieved.

Annual Faculty Performance Evaluation - ohio.edu
www.ohio.eduThe Annual Faculty Performance Evaluation Policy originated in April 2013, and replaced the former policies AP0005 and AP0006 pertaining to the annual Performance Evaluation Plan. This new policy was approved by a majority of faculty voting {INSERT DATE}. Next review: Academic year 2017-18.

Columbus State Community College – Ohio University Plan
www.ohio.eduColumbus State Community College – Ohio University Plan RN to BSN Online Program Pathway The Ohio University School of Nursing RN to BSN program is …

FEA Good Modeling Practices Issues and examples
www.ohio.eduA F σ=Eεor Basic Concepts in Finite Element Analysis Finite elements are small interconnected geometrical entities connected to other elements through nodes (1D), boundary lines (2D), and …

Fall Semester 2021-22 - Ohio University
www.ohio.eduregistrar@ohio.edu 740.593.4191 Approved: 3/29/21 Published: 3/30/21Athens, Updated 6/21/21; 8/5/21 Page 1 Academic Calendar 2021-22 Updated 8/5/21 Office of the University Registrar Office of the University Registrar Chubb Hall, First Floor 1 Ohio University Drive OH 45701-2979 Fall Semester 2021-22 August 23 – December 11, 2021
Related documents
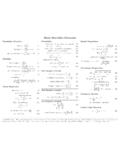
Basic Statistics Formulas - Integral Table
integral-table.comTable Entry Standard Normal Cumulative Proportions (below) TailArea 1-C 2 AreaC t-Distribution Critical Values (to right) Standard Normal Cumulative Proportions
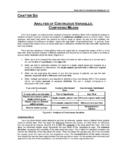
ANALYSIS OF CONTINUOUS VARIABLES …
surgicalcriticalcare.net32 / A PRACTICAL GUIDE TO BIOSTATISTICS THE t DISTRIBUTION: ANALYSIS OF NORMALLY DISTRIBUTED DATA The t distribution is a probability distribution which is frequently used to evaluate hypotheses regarding the means of continuous variables. It is commonly referred to as "Student's t-test" after William Gosset, a mathematician with …
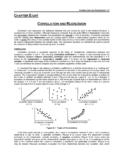
CORRELATION AND REGRESSION - …
surgicalcriticalcare.netCORRELATION AND REGRESSION / 49 For example, suppose we wish to compare cardiac index (CI) with RVEDVI and pulmonary artery occlusion pressure (PAOP) in 100 patients to determine whether changes in RVEDVI or PAOP correlate

ch8Bprac SHORT ANSWER. Write the word or …
www.leemath3000.orgch8Bprac SHORT ANSWER. Write the word or phrase that best completes each statement or answers the question. Identify the null hypothesis, alternative hypothesis, test statistic, P - value, conclusion about the null hypothesis, and final

Statistical Inference and t-Tests - Minitab
www.minitab.comStatistical Inference and t-Tests - Minitab ... Test

One and Two-sample t-tests - Department of …
www.stat.columbia.eduOne and Two-sample t-tests The R function t.test() can be used to perform both one and two sample t-tests on vectors of data. The function contains a variety of options and can be called as follows:

Statistics: 1.1 Paired t-tests - www.statstutor.ac.uk
www.statstutor.ac.ukStatistics: 1.1 Paired t-tests Rosie Shier. 2004. 1 Introduction A paired t-test is used to compare two population means where you have two samples in