
Tablas de IMC y Tablas de IMC Para la Edad, de niños(as) y ...
Tablas de IMC y tablas de IMC para la edad, de niños(as) y adolescentes de 5 a 18 años de edad y tablas de IMC para adultos(as) no embarazadas, no . lactantes ≥ 19 años de edad. Revisado en enero de 2013. Ejercicios para calcular el estado nutricional de los(as) niños(as) y adolescentes de 5 a 18 años de edad, y adultos(as) no embarazadas,
Download Tablas de IMC y Tablas de IMC Para la Edad, de niños(as) y ...
Information
Domain:
Source:
Link to this page:
Documents from same domain
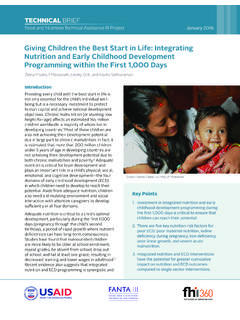
Giving Children the Best Start in Life: Integrating ...
www.fantaproject.orgTECNICAL BRIEF Integrating Nutrition and Early Childhood Development Programming within the First ff,111 Days 3 throughout life, this technical brief focuses on the . following key nutrition-related risk factors that evidence shows have a measured association with
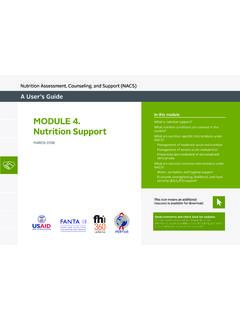
In this module MODULE 4. Nutrition Support - fantaproject.org
www.fantaproject.orgNACS USER’S GUIDE MODULE 4. WHAT IS NUTRITION SUPPORT? Nutrition support to prevent and treat malnutrition is one of the components of nutrition, assessment, counseling, and support (NACS) (see Module 1 for more information on NACS). It includes nutrition-specific. 1.

Theory of Change - fantaproject.org
www.fantaproject.orgTheory of Change Slide 2 meteorological, political and social) A theory of change is a set of diagrams and complementary text that describe, in detail, how outputs from interventions interact with: the outputs and outcomes of other concurrent interventions and
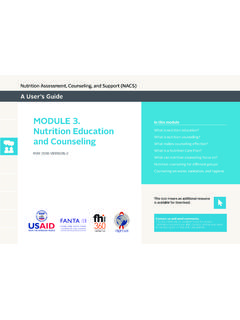
Module 3. Nutrition Education and Counseling (NACS User's ...
www.fantaproject.org2. Nutrition Counseling What Are Nutrition . Education and Counseling? NACS USER’S GUIDE MODULE 3, VERSION 2. NACS glossary. Based on the results of nutrition assessment, health
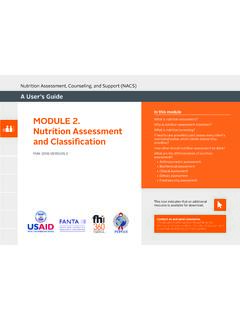
Why is nutrition assessment important? Nutrition Assessment
www.fantaproject.org5. Nutrition Assessment and . Classification Anthropometric . Assessment NACS USER’S GUIDE MODULE 2, VERSION 2. Weight . Weighing is usually the first step in anthropometric
BMI and BMI-for-Age Look-up Tables for Children and ...
www.fantaproject.orgBMI Look-Up Table for Non-Pregnant, Non-Lactating Adults ≥ 19 Years of Age (170–200 cm tall, table 1 of 2) _____ 9. BMI Look-Up Table for Non-Pregnant, Non-Lactating Adults ≥ 19 Years of Age (170–200 cm tall, table 2 of 2 _____ 10. This publication is made possible by the generous support of the American people through the support of ...
Tabela de IMC para crianças e adolescentes 15–18 anos de ...
www.fantaproject.orgTabelas de IMC and IMC-para-idade para crianças e adolescentes 5–18 anos de idade e tabelas de IMC para adultos não-grávidas, não-lactantes ≥ 19 anos de idade, janeiro 2013 . 1 . Exercícios para calcular o estado nutricional das crianças.
Household Food Insecurity Access Scale (HFIAS) for ...
www.fantaproject.orgBecause it is a complex, multidimensional concept, measuring food insecurity has been an ongoing challenge to researchers and practitioners alike. Until very recently, most household-level measures of food access, such as income and caloric adequacy, have been technically difficult, data-intensive, and costly to collect.
Indicator Performance Tracking Table (IPTT)
www.fantaproject.orgIndicator Performance Tracking Table (IPTT) Food and Nutrition Technical Assistance III Project (FANTA) FHI 360 1825 Connecticut Ave., NW Washington, DC 20009
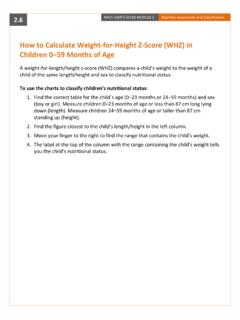
How to Calculate Weight-for-Height Z-Score (WHZ) in ...
www.fantaproject.orgHow to Calculate Weight-for-Height Z-Score (WHZ) in C hildren 0−59 Months of Age A weight-for-length/height z-score (WHZ) compares a child’s weight to the weight of a child of the same length/height and sex to classify nutritional status. To use the charts to classify children’s nutritional status: 1.
Related documents

TABLAS DE VERDAD - ieslaasuncion.org
ieslaasuncion.orgEjercicios de lógica Tablas de verdad . Departamento de Filosofía www.ieslaasuncion.org iv Descubra si las siguientes expresiones son EQUIVALENTES, es decir, si tienen la misma tabla de verdad. 1.- (p ↔ q) v (p → q) (p v q) ∧ (¬p →¬q) 2.- p ∧ ¬q → ¬p
Tablas indemnizatorias Baremo 2021 - Dirección General de ...
www.dgsfp.mineco.es&dwhjrutd (o &yq\xjh ylxgr +dvwd dxrv gh frqylyhqfld vl od ylfwlpd whqtd kdvwd dxrv ½ +dvwd dxrv gh frqylyhqfld vl od ylfwlpd whqtd ghvgh kdvwd dxrv ½
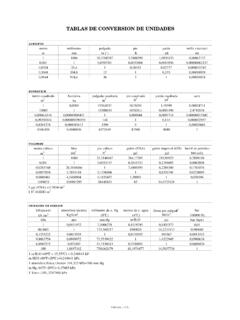
TABLAS DE CONVERSION DE UNIDADES
www.portalplanetasedna.com.arTABLAS DE CONVERSION DE UNIDADES LONGITUD metro milímetro pulgada pie yarda milla (statute) m mm in (¨) ft yd mi 1 1000 39,3700787 3,2808399 1,0936133 0,00062137
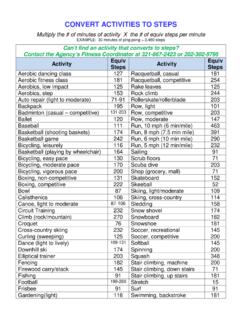
CONVERT ACTIVITIES TO STEPS - NASA
starport.jsc.nasa.govRow, competitive 203 Ballet 120 Row, moderate 147 Baseball 111 Run, 10 mph (6 min/mile) 463 Basketball (shooting baskets) 174 Run, 8 mph (7.5 min mile) 391
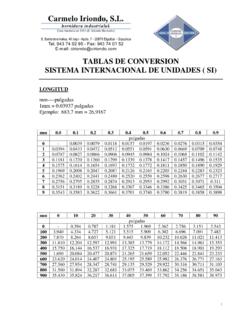
tablas de conversion - ciriondo.com
www.ciriondo.com1 TABLAS DE CONVERSION SISTEMA INTERNACIONAL DE UNIDADES ( SI) LONGITUD mm----pulgadas 1mm = 0.03937 pulgadas Ejemplo: 683,7 mm = …
dfuller — Augmented Dickey–Fuller unit-root test - Stata
www.stata.comdfuller— Augmented Dickey–Fuller unit-root test 3 Deciding which case to use involves a combination of theory and visual inspection of the data.
CURVAS Y TABLAS DE CRECIMIENTO - Webconsultas
www.webconsultas.comEn 19 82 se publicaron las tablas y curvas de 0 a 2 años, en 1985 las de 0 a 14 años y en 1988 las de 0 a 18 años, que han alcanzado una gran difu sión, tanto entre lo s pediatras y médicos de atención primaria como entre los colegas de otras especialidades y en la mayoría de las
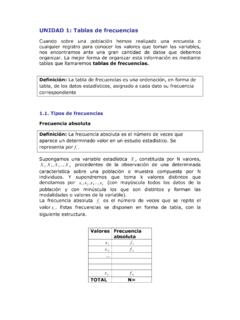
UNIDAD 1: Tablas de frecuencias - Gobierno de Canarias
www3.gobiernodecanarias.orgUNIDAD 1: Tablas de frecuencias Cuando sobre una población hemos realizado una encuesta o cualquier registro para conocer los valores que toman las variables, nos encontramos ante una gran cantidad de datos que debemos organizar. La mejor forma de organizar esta información es mediante tablas que llamaremos tablas de frecuencias.