
United States Department of Agriculture
demand projections. The 2022 planted area outlook shows a slight increase in combined corn, wheat, and soybean acres from last year and the highest total since 2014. Combined acreage for corn and soybeans is expected to reach
Download United States Department of Agriculture
Information
Domain:
Source:
Link to this page:
Documents from same domain
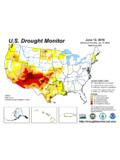
2018 Farm Bill & Legislative Principles
www.usda.govUnited States Department of Agriculture 2018 Farm Bill & Legislative Principles The U.S. Department of Agriculture (USDA) uniquely touches the lives of all Americans daily, through the food they eat, the fibers they wear,
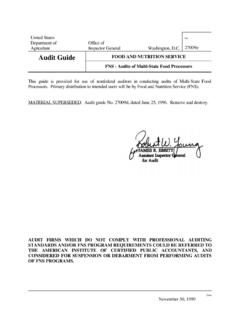
Approximate Percentage of Corn Located in …
www.usda.gov4 5 1 10 34 2 32 27 1 15 2 1 7 15 25 22 9 2 5 24 6 3 5 5 1 1 10 54 2 32 76 1 43 14 10 10 20 30 40 50 60 70 80 90 100) ) ) ) ) ) )) ) ) ) ) ) ) ) ) s s Approximate Percentage of Corn Located in Drought *
United States Office of Agriculture Audit Guide …
www.usda.govDate November 30, 1999 United States Department of Agriculture Office of Inspector General Washington, D.C.
United States Department of Agriculture Chief …
www.usda.gov0 United States Department of Agriculture Office of the Chief Economist Office of Energy Policy and New Uses Agricultural Economic Report

Offenses Involving Federal Food Stamp Benefits - …
www.usda.govhe United States Department of Agriculture (USDA), under coopera-tive Federal-State agreements, United States Department of Agriculture Office of Inspector General
Lesson 1: What Is the National Incident …
www.usda.govLesson 1: What Is the National Incident Management System (NIMS)? Summary of Lesson Content NIMS Page 3 Preparedness Effective incident management begins with a host of preparedness activities.
CONTINGENCY PLAN FOR OPERATIONS - USDA
www.usda.govCONTINGENCY PLAN FOR OPERATIONS . ... employees from the Natural Resources Conservation Service (NRCS) ... Human Resources Officer; ...
LOCKUP August 2018 - USDA
www.usda.govNext Release: September 12, 2018 1 - UNITED STATES During July, Midwestern growing conditions overall remained mostly favorable, despite pockets of drought in
INTERNATIONAL CROP AND WEATHER …
www.usda.govINTERNATIONAL CROP AND WEATHER HIGHLIGHTS USDA/WAOB Joint Agricultural Weather Facility August 14, 2018 EUROPE – Highlight: Rain Eased Northern Drought

weather WEEKLY WEATHER AND CROP BULLETIN - …
www.usda.govAugust 14, 2018 Weekly Weather and Crop Bulletin 5 (Continued from front cover) fieldwork but hampering wildfire containment efforts and …
Related documents

Employment Projections 2020-2030 - Bureau of Labor …
www.bls.govprojections decade as industry output and employment normalize, returning to their long-term ... demand arising from economic changes spurred by the pandemic (see Technical Note for discussion of the difference between cyclical and structural changes). For example, many
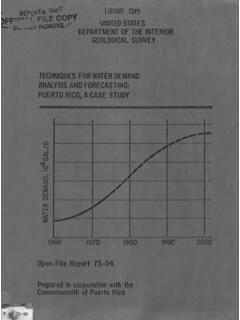
TECHNIQUES FOR WATER DEMAND ANALYSIS AND …
pubs.usgs.gova data base, irrigation -water demand projections were not made in this study. This report does, however, present a demand analysis along with operational procedures for forecasting residential, commercial, and industrial water demand on a municipio basis. Discussion in the second part of the report relates to the regional economic impact, of ...
National Projections of Supply and Demand for Selected ...
bhw.hrsa.govDemand projections reflect impacts associated with both changes in population demographics and changes in insurance coverage. 8. The following subsections detail a range of supply and demand projections by provider type based on two scenarios. U nder Scenario One (baseline), the 2013 demand for each behavioral
Supply and Demand Projections of the Nursing Workforce ...
bhw.hrsa.govSupply and Demand Projections for the Nursing Workforce: 2014-2030 3 . impact of the way health care was delivered in the base year (2014) and that there will be stability in the current rates of health care utilization. In addition, the supply model assumes that current

2019 Accounting Graduates Supply and Demand Report
us.aicpa.orgThe more telling projections in this report about the profession come from the demand side in public accounting. New hires assigned to audit-related services increased 4 percentage points. Across the last two Trends reports, we have experienced an approximate 30% decline in hiring of new accounting graduates.
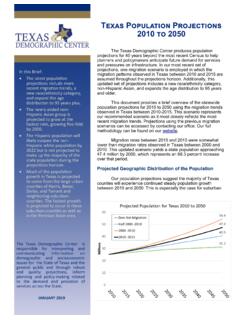
Texas Population Projections 2010 to 2050
demographics.texas.govJan 28, 2019 · Texas Population Projections 2010 to 2050 The Texas Demographic Center produces population projections for 40 years beyond the most recent Census to help planners and policymakers anticipate future demand for services and pressures on infrastructure. In our most recent set of projections, one migration scenario is employed in which the
Handout for Part 1 Introduction to Population Projections
www.jhsph.eduthe demand for technical assistance for use of the suite of models known as Spectrum. The Spectrum software was created by predecessor projects with funding from USAID. ... projections are always set on a “conditional” future Always based on a ‘conditional’ future.
World Agricultural Supply and Demand Estimates
www.usda.govglobal demand growth. Global 2021/22 soybean trade is reduced 6.4 million tons to 158.6 million, with lower exports for South America that are partly offset by higher U.S. exports. Imports for China are reduced 3 million tons to 94 million. Other markets with lower imports include Russia, Bangladesh, Egypt, the EU, Pakistan, Argentina, and Belarus.