
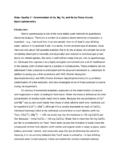
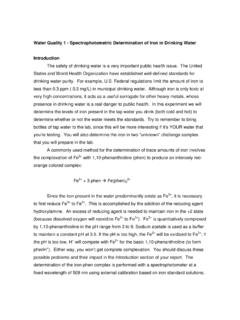
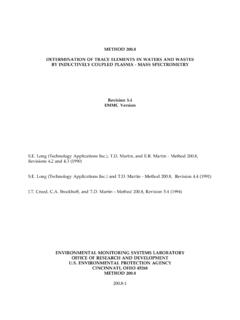
X-ray Diffraction (XRD)
Detection of Diffracted X-rays by Photographic film A sample of some hundreds of crystals (i.e. a powdered sample) show that the diffracted beams form continuous cones. A circle of film is used to record the diffraction pattern as shown. Each cone intersects the film giving diffraction lines. The lines are seen as arcs on the film.
Download X-ray Diffraction (XRD)

Information
Domain:
Source:
Link to this page:
Documents from same domain
Unterrichtsmaterial & Arbeitsblätter
web.pdx.eduUnterrichtsmaterial und Arbeitsblätter für Lehrer in Mathematik 4/26/10 7:13 PM http://www.unterrichtsmaterial-schule.de/unterrichtsmaterialm.shtml Page 2 of 4
Determination of Calcium, Magnesium, and …
web.pdx.eduHardness can be determined by a number of methods including EDTA titration (as is done in CH 321) and atomic absorption and emission spectrophotometry.
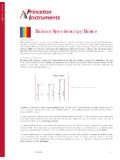
Raman Spectroscopy Basics - Portland State …
web.pdx.eduRaman Basics page 1 of 5 …SEE the Future Introduction Raman spectroscopy is a spectroscopic technique based on inelastic scattering of …
Policy Success, Policy Failure and Grey Areas In …
web.pdx.eduPolicy Success, Policy Failure and Grey Areas In-Between ALLAN M CONNELL Government and International Relations, University of Sydney ABSTRACT Policy protagonists are keen to claim that policy is successful while
Exercises and Problems in Linear Algebra
web.pdx.eduAnton and Chris Rorres and Linear Algebra and its Applications [10] by Gilbert Strang are loaded with applications. If you are a student and nd the level at which many of the current beginning linear algebra
Distinguishing Between Random and Fixed
web.pdx.eduNewsom Psy 510/610 Multilevel Regression, Spring 2017 1 . Distinguishing Between Random and Fixed: Variables, Effects, and Coefficients
ANTH 103: INTRODUCTION TO SOCIAL/CULTURAL …
web.pdx.eduThis course introduces the student to branch of anthropology known as sociocultural anthropology. The texts, lectures, films, discussions, projects, and other assignments are The texts, lectures, films, discussions, projects, and other assignments are
t-Tests, Chi-squares, Phi, Correlations: It’s all the …
web.pdx.eduNewsom 1 USP 634 Data Analysis Spring 2013 t-Tests, Chi-squares, Phi, Correlations: It’s all the same stuff . In this handout, I provide illustrations of the connection between t-tests and correlations and between chi-
Apparatus - Portland State University
web.pdx.eduWater Quality 1 - Spectrophotometric Determination of Iron in Drinking Water Introduction The safety of drinking water is a very important public health issue.
Simple Invoicing Desktop Database with MS …
web.pdx.eduSimple Invoicing Desktop Database with MS Access 2013 A Database Management System (DBMS) is a set of procedures and tools to store and retrieve information. The database itself is the stored information. The types of information stored in the database are de ned by the corresponding data structures. The database
Related documents
EPA Method 6020A (SW-846): Inductively Coupled Plasma ...
19january2017snapshot.epa.govdetection limits, sensitivities, and linear ranges will vary with the matrices, instrumentation, and operating conditions. In relatively simple matrices, detection limits will generally be below 0.1 µg/L. Less sensitive elements (like Se and As) and desensitized major elements may be …

Silicon Drift Detectors Explained
engineering.temple.eduBeryllium (Be) is highly robust, but strongly absorbs low energy X-rays meaning that only elements from sodium (Na) can be detected. Polymer-based thin windows can be made much thinner than Be windows and therefore are transparent to much lower energy X-rays, many allowing detection of X-rays down to 100 eV. Although these window materials are

ELEMENTS by ICP 7300 (Nitric/Perchloric Acid Ashing)
www.cdc.govand 10x the instrumental detection limits on comm ercially prepared spiked filters [12] using 25.0 mL as the final sample vol ume. Tables 3 and 4 list the precision and recovery data, instrumental detection limits, and analy tical wav elen gths for m ixed cellulos e es ter (M CE ) and polyvinyl chlo ride (P VC ) filters. PVC Filt ers whi ch

ELEMENTS by ICP 7301 (Aqua Regia Ashing)
www.cdc.govberyllium iron* molybdenum strontium vanadium cadmium lanthanum nickel tellurium yttrium ... The precision and recovery data were determined at approximately 3x and 10x the instrumental detection limits on commercially prepa red spiked filters [1 2] using 25.0 mL as the f inal sample vol ume. The precisi on

THEORY OF XRF - Purdue University
www.chem.purdue.edufrom sodium to uranium (Na to U). For WDXRF it is even wider, from beryllium to uranium (Be to U). The concentration range goes from (sub) ppm levels to 100%. Generally speaking, the elements with high atomic numbers have better detection limits than the lighter elements. The precision and reproducibility of XRF analysis is very high.
METHOD 200.7 DETERMINATION OF METALS AND TRACE …
www.epa.gov1.10 Detection limits and linear ranges for the elements will vary with the wavelength selected, the spectrometer, and the matrices. Table 1 provides estimated instrument detection limits for the listed wavelengths. However,7 actual method detection …
EPA Method 200.8: Determination of Trace Elements in ...
www.epa.govInstrument Detection Limit (IDL) - The concentration equivalent to the analyte signal which is equal to three times the standard deviation of a series of 10 replicate measurements of the calibration blank signal at the selected analytical mass(es). (Table 1). 3.6