Transcription of Using LabVIEW to Measure Temperature with a Thermistor
1 Page 1 of 18 Using LabVIEW to Measure Temperature with a Thermistor C. Briscoe and W. Dufee, University of Minnesota November, 2009 For resources, see the LabVIEW Resources page on the UMN ME2011 course site. Before starting this exercise, install LabVIEW and drivers following the instructions in the LabVIEW Quick Start document, and connect and test the USB-68008 data acquisition unit following the directions in the Connecting the USB-68008 document. The screen shots shown in this document are from a Windows VISTA machine. Your setup may have slight differences. Introduction The purpose of the exercise is to give you some experience Using LabVIEW for automatic, computer-based data collection from an experiment. You will be measuring the internal Temperature of a grape or similar object as a function of time as it is plunged into a glass of ice water.
2 Using the collected data, you will determine the time constant of the heat transfer dynamics that model the Temperature drop. What You Will Need 1. Computer running LabVIEW 2. National Instruments (NI) USB-68008 data acquisition unit 3. USB cable 4. Thermistor Temperature sensor (NTC, 10K ohms, , PN 207037) 5. Digital multi-meter that can read resistance 6. Solderless breadboard 7. 22 g solid wire 8. A 10K ohm resistor 9. A grape, or other small fruit, at room Temperature 10. A glass of ice water USB-6008 Thermistor Thermistors Thermistors are resistors that vary with Temperature . The resistance R of a Thermistor at Temperature T can be modeled by Page 2 of 18 =RRTTBRR11exp (1) where RR is the resistance at a reference Temperature TR and B is a constant.
3 In order for Equation 1 to work, absolute temperatures (Kelvin units) must be used. The Thermistor used in this project, ( PN 207037) has a resistance RR of 10,000 ohms at the reference Temperature TR of 298 K (25 C) and a B value of 4038, with 10% tolerance on the resistance. Try plunging your Thermistor into ice water, which is approximately 273 K (0 C) and Measure the resistance across the leads Using your DMM. (Hint: squeeze the DMM leads hard against the Thermistor leads for an accurate resistance reading.) See how close the measured value of R is to the theoretical value from Equation 1. You may see the resistance measurement drifting due to self-heating from the current through the Thermistor provided by the DMM. Rearranging Equation 1 for Temperature as a function of resistance yields 1ln11 +=RRRRBTT (2) Measuring Circuit The data acquisition pod can only Measure voltage, not resistance.
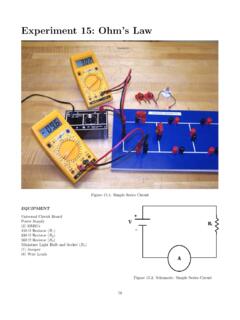
4 You will construct a voltage divider circuit to Measure resistance. The schematic for a voltage divider is shown below V_i is a fixed supply voltage, which for the experiment will be +5V. R1 is a 10K ohm resistor . R is the Thermistor whose resistance varies with Temperature . V is the output voltage that will be sampled by the data acquisition unit. The equation for V is RRRVVi+=1 (3) Rearranging to find R yields Page 3 of 18 )(1 VVVRRi = (4) Inserting Equation 4 into Equation 2 gives the equation for Temperature as a function of the voltage measured by the data acquisition unit 11)(ln11 +=VVRVRBTTiRR (5)
5 For the setup in your experiment, the values for the constants in this equation are T_R [deg K] 298R_R [ohms] 10,000B [unitless] 4038R_1 [ohms] 10,000V_i [volts] 5 Equation 5 gives you the Temperature in Kelvin. For convenience, the output should be in Fahrenheit or Celsius. Here are the conversion formulas [deg F] = [deg K] * 460 [deg C] = [deg K] 273 Suggestion: Give yourself an engineering challenge and see if you can derive Equations 2-5 on your own. Equation 3 can be derived Using Ohm s Law, V = I*R. LabVIEW VI The first step in the experiment is to program a custom LabVIEW VI to sample the voltage from the voltage divider and convert it into a Temperature reading. You will do this in two steps, first creating the conversion section then creating the data acquisition setting.
6 This way you can proceed with a good portion of the experiment setup without needing the data acquisition hardware. It is assumed that you have read the LabVIEW Quick Start document that describes the basics of LabVIEW . Start LabVIEW and create a new blank VI. On the Front Panel, place two Numeric Indicators and a Gauge. Change one of the indicators to a Control (R-click > Change to control) and change its label to Reading [V] (R-click > Properties). The indicator is a placeholder for the voltage reading that later will come from the data acquisition unit. On the other indicator, suppress the label (R-click > Visible Items > Label) and align under the gauge (alignment tool button is at the top of the Page 4 of 18 window). Using the Properties function, change the gauge label to Temp [F] and change its min and max to 20 and 100.
7 Your front panel will look something like this1 Save your VI. Activate the Block Diagram (Ctrl-E to switch between Front Panel and Block Diagram) and wire the output of the reading indicator to the inputs of the gauge and the second indicator. Your block diagram will look something like this Return to the front panel and run the application with the Run Continuously button. Change the value in the reading indicator and confirm that the gauge and second indicator follow. Stop the application with the Abort button. 1 You might like the Meter or Thermometer numeric indicators more than the Gauge. Feel free to explore and modify the instructions to suit your taste. Page 5 of 18 The next step is to add the conversion between voltages read by the data acquisition unit and Temperature read by the gauge.
8 Return to the block diagram and delete the wire connections. Ctrl-B is useful for clearing dangling wires. Place a Formula block on the diagram. (Forget how? Consult the LabVIEW Quick Start document.) In the Configure Formula dialog box (if it doesn t appear, R-click > Properties), change the label on Input X1 to V. Starting with Equation 5, substituting the constants from the table, noting that R_1 and R_r cancel in the ln function, adding in the Kelvin to Fahrenheit conversion and expressing in plain text format, the formula for Temperature [F] from voltage is ((1/298)+(1/4038)*ln(V/(5-V)))**(-1) * - 460 Type this into the Configure Formula box. If the box to the right of the formula turns green, the formula is syntactically correct. The Configure Formula box will look like this Back on the block diagram, wire the Reading indicator to the input V of the formula block and wire the output Result of the formula block to the gauge and the second indicator blocks.
9 (The Edit > Clean Up Diagram, Ctrl-U, function is useful if the diagram gets messy.) Your Block Diagram will look like this Page 6 of 18 Return to the Front Panel and run the application, entering voltage readings between zero and 5 volts. If everything is correct, you will get these pairs of values from your VI. Volts Temp [deg F] For the remainder of this exercise, you will need the USB-6008 unit. Measuring Voltages The next step is to use the USB-6008 and modify the VI to collect samples from it. Connect the USB-6008 to your computer with the USB cable. The green LED on the device will blink. Go to the Front Panel of your VI and delete the reading indicator. Switch to the Block Diagram. Open the Functions Palette. Navigate to Express > Input. Insert the DAQ Assistant block onto the diagram.
10 If you are prompted about licensing restrictions, click the box that says you understand then click Next. The Create New Express Task box is next. Select Acquire Signals > Analog Input > Voltage Page 7 of 18 In the next box, select ai0 as the channel to read from. This corresponds to one of the screw terminal connections on the device. Click Finish. The DAQ Assistant dialog box will open. Under the Configuration tab, enter these settings Terminal Configuration = RSE (to read voltage with respect to GND pin) Signal Input Range: Max = 5, Min = 0 Scaled Units = Volts Acquisition Mode = N Samples Samples to Read = 10 Rate (Hz) = 1k The box will look like this Page 8 of 18 Click OK to finish the process of inserting the DAQ Assistant into the block diagram. Add a Numeric Control to the Front Panel, change it to an indicator and change its label to Volts.