Transcription of Introduction to Simulation Using R
1 Chapter 13 Introduction to Simulation Using RA. Rakhshan and H. Analysis versus Computer SimulationA computer Simulation is a computer program which attempts to represent the real world basedon a model. The accuracy of the Simulation depends on the precision of the model. Suppose thatthe probability of heads in a coin toss experiment is unknown. We can perform the experimentof tossing the coinntimes repetitively to approximate the probability of (H) =Number of times heads observedNumber of times the experiment executedHowever, for many practical problems it is not possible to determine the probabilities by exe-cuting experiments a large number of times. With today s computers processing capabilities, weonly need a high-level language, such as R, which can generate random numbers, to deal withthese this chapter, we present basic methods of generating random variables and simulateprobabilistic systems.
2 The provided algorithms are general and can be implemented in anycomputer language. However, to have concrete examples, we provide the actual codes in R. Ifyou are unfamiliar with R, you should still be able to understand the Introduction : What is R?R is a programming language that helps engineers and scientists find solutions for given statisti-cal problems with fewer lines of codes than traditional programming languages, such as C/C++or Java, by utilizing built-in statistical functions. There are many built-in statistical functionsand add-on packages available in R. It also has high quality customizable graphics is available for Unix/Linux, Windows, and Mac. Besides all these features, R is free! Discrete and Continuous Random Number GeneratorsMost of the programming languages can deliver samples from the uniform distribution to us(In reality, the given values are pseudo-random instead of being completely random.)
3 The rest12 CHAPTER 13. Introduction TO Simulation Using RA. RAKHSHAN AND H. PISHRO-NIKof this section shows how to convert uniform random variables to any other desired randomvariable. The R code for generating uniform random variables is:U=runif(n,min= 0,max= 1)which returns a pseudorandom value drawn from the standard uniform distribution on the openinterval (0,1). Generating Discrete Probability Distributions from Uniform Distri-butionLet s see a few examples of generating certain simple distributions:Example 1.(Bernoulli) Simulate tossing a coin with probability of :LetUbe a Uniform(0,1) random variable. We can write Bernoulli random variableXas:X={1U < p0U pThus,P(H) =P(X= 1)=P(U < p)=pTherefore,XhasBernoulli(p) distribution. The R code forBernoulli( ) is:p= ;U=runif(1,min= 0,max= 1);X= (U < p);Since the runif(1, min = 0, max = 1) command returns a number between 0 and 1, we dividedthe interval [0,1] into two parts,pand 1 pin length.}
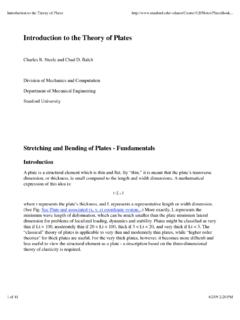
4 Then, the value ofXis determined basedon where the number generated from uniform distribution 2.(Coin Toss Simulation ) Write codes to simulate tossing a fair coin to see how thelaw of large numbers :You can DISCRETE AND CONTINUOUS RANDOM NUMBER GENERATORS3n= 1000;U=runif(n,min= 0,max= 1);toss=U < ;a=numeric(n+ 1);avg=numeric(n);for(i in2 :n+ 1){a[i] =a[i 1] +toss[i 1];avg[i 1] =a[i]/(i 1);}plot(1 :n,avg[1 :n],type= l ,lwd= 5,col= blue ,ylab= ProportionofHeads ,xlab= CoinTossNumber , , , )If you run the above codes to compute the proportion of ones in the variable toss, the resultwill look like Figure You can also assume the coin is unbiased with probability of headsequal to by replacing the third line of the previous code with:toss=U < ;Figure : R - coin toss simualtion4 CHAPTER 13. Introduction TO Simulation Using RA. RAKHSHAN AND H. PISHRO-NIKE xample 3.(Binomial) Generate aBinomial(50, ) random :To solve this problem, we can use the following lemma:Lemma ,X2.
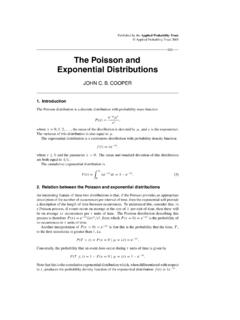
5 ,Xnare independentBernoulli(p) random variables, then the randomvariableXdefined byX=X1+X2+..+Xnhas aBinomial(n,p) generate a random variableX Binomial(n,p), we can toss a coinntimes and count thenumber of heads. Counting the number of heads is exactly the same as findingX1+X2+..+Xn,where eachXiis equal to one if the corresponding coin toss results in heads and zero we know how to generate Bernoulli random variables, we can generate aBinomial(n,p)by addingnindependentBernoulli(p) random ;n= 50;U=runif(n,min= 0,max= 1);X=sum(U < p);Generating Arbitrary Discrete DistributionsIn general, we can generate any discrete random variables similar to the above examples usingthe following algorithm. Suppose we would like to simulate the discrete random variableXwithrangeRX={x1,x2,..,xn}andP(X =xj) =pj, so jpj= achieve this, first we generate a random numberU( ,U Uniform(0,1)). Next, wedivide the interval [0,1] into subintervals such that thejth subinterval has lengthpj( ).
6 AssumeX= x0if (U < p0)x1if (p0 U < p0+p1)..xjif( j 1k=0pk U < jk=0pk)..In other wordsX=xjifF(xj 1) U < F(xj),whereF(x) is the desired CDF. We haveP(X=xj) =P(j 1 k=0pk U <j k=0pk)= DISCRETE AND CONTINUOUS RANDOM NUMBER GENERATORS501p0p1p2p3 pjFigure : Generating discrete random variablesExample an algorithm to simulate the value of a random variableXsuch thatP(X= 1) = (X= 2) = (X= 3) = (X= 4) = :We divide the interval [0,1] into subintervals as follows:A0= [0, )A1= [ , )A2= [ , )A3= [ ,1)SubintervalAihas lengthpi. We obtain a uniform numberU. IfUbelongs toAi, thenX= (X=xi) =P(U Ai)=piP=c( , , ,1);X=c(1,2,3,4);counter= 1;r=runif(1,min= 0,max= 1);while(r > P[counter])counter=counter+ 1;endX[counter] Generating Continuous Probability Distributions from the UniformDistribution- Inverse Transformation MethodAt least in principle, there is a way to convert a uniform distribution to any other s see how we can do this.]]]]
7 LetU Uniform(0,1) andFbe a CDF. Also, assumeFiscontinuous and strictly increasing as a 13. Introduction TO Simulation Using RA. RAKHSHAN AND H. PISHRO-NIKT heorem Uniform(0,1) andFbe a CDF which is strictly increasing. Also,consider a random variableXdefined asX=F 1(U).Then,X F(The CDF ofXisF)Proof:P(X x) =P(F 1(U) x)=P(U F(x)) (increasing function)=F(x)Now, let s see some examples. Note that to generate any continuous random variableXwiththe continuous cdfF,F 1(U) has to be 5.(Exponential) Generate an Exponential(1) random :To generate an Exponential random variable with parameter = 1, we proceedas followsF(x) = 1 e xx >0U Uniform(0,1)X=F 1(U)= ln(1 U)X FThis formula can be simplified since1 U Uniform(0,1)01U1 UFigure : Symmetry of UniformHence we can simulateXusingX= ln(U)U=runif(1,min= 0,max= 1);X= log(U) DISCRETE AND CONTINUOUS RANDOM NUMBER GENERATORS7 Example 6.(Gamma) Generate a Gamma(20,1) random :For this example,F 1is even more complicated than the complicated gamma cdfFitself.
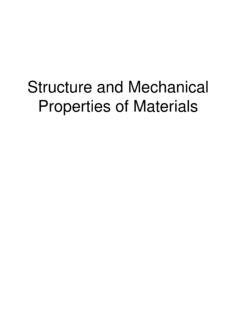
8 Instead of inverting the CDF, we generate a gamma random variable as a sum ofnindependent exponential ,X2, ,Xnbe independent random variables withXi Exponential( ).DefineY=X1+X2+ +XnBy the moment generating function method, you can show thatYhas a gamma distributionwith parametersnand , ,Y Gamma(n, ).Having this theorem in mind, we can write:n= 20;lambda= 1;X= ( 1/lambda) sum(log(runif(n,min= 0,max= 1)));Example 7.(Poisson) Generate a Poisson random variable. Hint: In this example, use the factthat the number of events in the interval [0,t] has Poisson distribution when the elapsed timesbetween the events are :We want to employ the definition of Poisson processes. AssumeNrepresents thenumber of events (arrivals) in [0,t]. If the interarrival times are distributed exponentially (withparameter ) and independently, then the number of arrivals occurred in [0,t],N, has Poissondistribution with parameter t(Figure ).
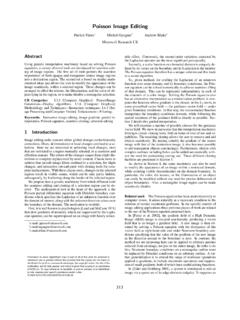
9 Therefore, to solve this problem, we can repeatgeneratingExponential( ) random variables while their sum is not larger than 1 (choosingt= 1). More specifically, we generateExponential( ) random variablesTi= 1 ln(Ui)by first generating uniform random variablesUi s. Then we defineX= max{j:T1+ +Tj 1}The algorithm can be simplified:X= max{j: 1 ln(U1 Uj) 1}8 CHAPTER 13. Introduction TO Simulation Using RA. RAKHSHAN AND H. PISHRO-NIKL ambda= 2;i= 0;U=runif(1,min= 0,max= 1);Y= (1/Lambda) log(U);sum=Y;while(sum <1){U=runif(1,min= 0,max= 1);Y= (1/Lambda) log(U);sum=sum+Y;i=i+ 1;}X=i01 Exp( )Exp( )Exp( )Exp( )X= Maximum number of exponential random variablesFigure : Poisson Random VariableTo finish this section, let s see how to convert uniform numbers to normal random distribution is extremely important in science because it is very commonly 3.(Box-Muller transformation) We can generate a pair of independent normal vari-ables (Z1,Z2) by transforming a pair of independentUniform(0,1) random variables (U1,U2)[1].
10 {Z1= 2 lnU1cos(2 U2)Z2= 2 lnU1sin(2 U2)Example 8.(Box-Muller) Generate 5000 pairs of normal random variables and plot :We display the pairs in Matrix R COMMANDS FOR SPECIAL DISTRIBUTIONS9n= 5000;U1 =runif(n,min= 0,max= 1)U2 =runif(n,min= 0,max= 1)Z1 =sqrt( 2 log(U1)) cos(2 pi U2)Z2 =sqrt( 2 log(U1)) sin(2 pi U2)hist(Z1,col= wheat ,label=T)Figure : Histogram ofZ1, a normal random variable generated by Box-Muller R Commands for Special DistributionsIn this section, we will see some useful commands for commonly employed distributions. Func-tions which start with p , q , d , and r give the cumulative distribution function (CDF),the inverse CDF, the density function (PDF), and a random variable having the specified dis-tribution 13. Introduction TO Simulation Using RA. RAKHSHAN AND H. PISHRO-NIKB inomialpbinom qbinomdbinom rbinomGeometricpgeom qgeomdgeom rgeomNegativeBinomialpnbinom qnbinomdnbinom rnbinomPoissonppois qpoisdpois rpoisBetapbeta qbetadbeta rbetaBetapbeta qbetadbeta rbetaExponentialpexp qexpdexp rexpGammapgamma qgammadgamma rgammaStudenttpt qtdt rtUniformpunif qunifdunif Exercises1.}


![[FMM] Finite Mixture Models - Stata](/cache/preview/2/f/e/3/5/9/b/e/thumb-2fe359bec6e16b9423570fba22429479.jpg)