Transcription of A short list of the most useful R commands
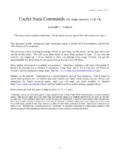
1 A short list of the most useful R commands A summary of the most important commands with minimal examples. See the relevant part of the guide for better examples. For all of these commands , using the help(function) or ? function is the most useful source of information. Unfortunately, knowing what to ask for help about is the hardest problem. See the R-reference card by Tom short for a much more complete list. Input and display #read files with labels in first row (filename,header=TRUE) #read a tab or space delimited file (filename,header=TRUE,sep=',') #read csv files x=c(1,2,4,8,16 ) #create a data vector with specified elements y=c(1.)
2 10) #creat a data vector with elements 1-10 n=10 x1=c(rnorm(n)) #create a n item vector of random normal deviates y1=c(runif(n))+n #create another n item vector that has n added to each random uniform distribution z=rbinom(n,size,prob) #create n samples of size "size" with probability prob from the binomial vect=c(x,y) #combine them into one vector of length 2n mat=cbind(x,y) #combine them into a n x 2 matrix mat[4,2] #display the 4th row and the 2nd column mat[3,] #display the 3rd row mat[,2] #display the 2nd column subset(dataset,logical) #those objects meeting a logical criterion subset( ,select=variables,logical)
3 #get those objects from a data frame that meet a criterion [ ] #yet another way to get a subset x[order(x$B),] #sort a dataframe by the order of the elements in B x[rev(order(x$B)),] #sort the dataframe in reverse order #a menu command that creates a window with information about all variables in the workspace moving around ls() #list the variables in the workspace rm(x) #remove x from the workspace rm(list=ls()) #remove all the variables from the workspace attach(mat) #make the names of the variables in the matrix or data frame available in the workspace detach(mat) #releases the names new=old[,-n] #drop the nth column new=old[n,] #drop the nth row new=subset(old,logical)
4 #select those cases that meet the logical condition complete = subset( , ( )) #find those cases with no missing values new=old[n1:n2,n3:n4] #select the n1 through n2 rows of variables n3 through n4) distributions beta(a, b) gamma(x) choose(n, k) factorial(x) dnorm(x, mean=0, sd=1, log = FALSE) #normal distribution pnorm(q, mean=0, sd=1, = TRUE, = FALSE) qnorm(p, mean=0, sd=1, = TRUE, = FALSE) rnorm(n, mean=0, sd=1) dunif(x, min=0, max=1, log = FALSE) #uniform distribution punif(q, min=0, max=1, = TRUE, = FALSE) qunif(p, min=0, max=1, = TRUE, = FALSE) runif(n, min=0, max=1) data manipulation replace(x, list, values) #remember to assign this to some object , x <- replace(x,x==-9,NA)
5 #similar to the operation x[x==-9] <- NA cut(x, breaks, labels = NULL, = FALSE, right = TRUE, = 3, ..) (x1,x2,x3 ..) #combine different kinds of data into a data frame () () x= () scale() #converts a data frame to standardized scores round(x,n) #rounds the values of x to n decimal places ceiling(x) #vector x of smallest integers > x floor(x) #vector x of largest interger < x (x) #truncates real x to integers (compare to round(x,0) (x < cutpoint))
6 #vector x of 0 if less than cutpoint, 1 if greater than cutpoint) factor(ifelse(a < cutpoint, "Neg", "Pos")) #is another way to dichotomize and to make a factor for analysis transform( ,variable names = some operation) #can be part of a set up for a data set x%in%y #tests each element of x for membership in y y%in%x #tests each element of y for membership in x all(x%in%y) #true if x is a proper subset of y all(x) # for a vector of logical values, are they all true?
7 Any(x) #for a vector of logical values, is at least one true? Statistics and transformations max() min() mean() median() sum() var() #produces the variance covariance matrix sd() #standard deviation mad() #(median absolute deviation) fivenum() #Tukey fivenumbers min, lowerhinge, median, upper hinge, max table() #frequency counts of entries, ideally the entries are factors(although it works with integers or even reals) scale(data,scale=T) #centers around the mean and scales by the sd) cumsum(x) #cumulative sum, etc.
8 Cumprod(x) cummax(x) cummin(x) rev(x) #reverse the order of values in x cor(x,y,use="pair") #correlation matrix for pairwise complete data, use="complete" for complete cases aov(x~y,data=datafile) #where x and y can be matrices = aov(DV~IV,data= ) #do the analysis of variance or = aov(DV~IV1*IV21,data= ) #do a two way analysis of variance summary ( ) #show the summary table print( ( ,"means"),digits=3) #report the means and the number of subjects/cell boxplot(DV~IV,data= ) #graphical summary appears in graphics window lm(x~y,data=dataset) #basic linear model where x and y can be matrices (see for plotting options) (x,g) (x,g) (groups = NULL, n = NULL, = NULL, = NULL, = , power = NULL) (n = NULL, delta = NULL, sd = 1, = , power = NULL, type = c(" ", " ", "paired"), alternative = c(" ", " "),strict = FALSE) More statistics.
9 Regression and Linear model lm(Y~X) #Y and X can be matrices lm(Y~X1+X2) lm(Y~X|W) solve(A,B) #inverse of A * B - used for linear regression solve(A) #inverse of A factanal() princomp() useful additional commands colSums (x, = FALSE, dims = 1) rowSums (x, = FALSE, dims = 1) colMeans(x, = FALSE, dims = 1) rowMeans(x, = FALSE, dims = 1) rowsum(x, group, reorder = TRUE, ..) #finds row sums for each level of a grouping variable apply(X, MARGIN, FUN.)
10 #applies the function (FUN) to either rows (1) or columns (2) on object X apply(x,1,min) #finds the minimum for each row apply(x,2,max) #finds the maximum for each column (x) #another way to find which column has the maximum value for each row (x) (x) z=apply(big5r,1, ) #tells the row with the minimum value for every column Graphics par(mfrow=c(nrow,mcol)) #number of rows and columns to graph par(ask=TRUE) #ask for user input before drawing a new graph par(omi=c(0,0,1,0) ) #set the size of the outer margins mtext("some global title",3,outer=TRUE,line=1,cex= ) #note that we seem to need to add the global title last #cex = character expansion factor boxplot(x,main="title") #boxplot (box and whiskers) title( "some title") #add a title to the first graph hist()