Transcription of TIME SERIES REGRESSION - University of Delaware
1 Yt''$$0%%$$1Xt%%ggtDEPARTMENT OF POLITICAL SCIENCEANDINTERNATIONAL RELATIONSPosc/Uapp 816 time SERIES REGRESSION couple of general considerations in analyzing time SERIES of simple interupted time SERIES the adequacy of the PROBLEMS IN ANALYZING time the last class (Class 19) we used REGRESSION to see how an intervention affected a dependent variable measured at discrete time ll continue that analysis in a we first need to review the assumptions underlying REGRESSION analysis,particularly those pertaining to the error time is the unit of analysis we can still regress some dependentvariable, Y, on one or more independent time we dealt with a particularly simple variable, a timecounter.
2 1)That is, X was defined as X = 1, 2, 3, .., form of a REGRESSION model with one explanatory variable about , the error term ( ) = 0, zero ( ) = , constant variancet2 ( , X) = 0, no correlation with ( , ) , no ~ Normally distributed (for hypothesis testing). four is especially important and most likely not to be met whenusing time SERIES is not uncommon for errors to track themselves; that is, for the error atime t to depend in part on its value at t - m, where m is a prior 0Yt''$$0%%$$1Xt%%ggtggt''DDggt&&1%%<<tPo sc/Uapp 816 Class 20 REGRESSION of time SeriesPage most common situation occurs when m = 1, which is called afirst-order autocorrelation1)This form indicates that the errors at a prior time ( , oneprior time period) are correlated (not independent)
3 Of errorsat the following time view of that the errors in one time period are correlated with theerrors in the preceding time )This is actually a common a situation can be called a first-order autoregressive process:1)A simple linear model has the usual form2)But now the errors are related by the (linear) simpleregression function:3)That is the error at time t is a function of the error at time t- 1 and a random model has these properties. (That is, we make theseassumptions.)1)E[ ] = 0; the mean of disturbances is zero ( they canceltout );2)E[ ] = ; the disturbances have constant variance;t 2 23)E[ , ] = 0, disturbances are uncorrelated;tt - 14)E[ , ] = 0; no correlation between disturbance at t andtt - 1the error in the model at t - )-1 < < +1.
4 Rho, the autocorrelation parameter is a each error, , is a portion of the immediately preceding onetplus a random disturbance, it can be written as (using repeatedsubstitutions):ggt''DDggt&&1%%<< t''DD[DDggt&&2%%<<t&&1]%%<<t''DD2ggt&&2% %DD<<t&&1%%<<t''DD2[DDggt&&3%%<<t&&2]%%D D<<t&&1%%<<t''DD3ggt&&3%%DD2<<t&&1%%DD<< t&&1%%<<tetc.''DDtgg0%%DDt&&1<<t&&m%%1%% ..%%DD<<t&&1%%<<0E( Y)'' Posc/Uapp 816 Class 20 REGRESSION of time SeriesPage other words, the errors at time t, are created as a linear function of arandom disturbance and ultimately of the first or original error, we knew the value of the autocorrelation parameter.
5 We would be in aposition to specify the error structure and use OLS to estimate theparameters of the time SERIES REGRESSION since we don t a problem consequences of that an estimator is unbiased if its expected value equals thepopulation parameter it is : the mean is an unbiased estimator of the population meanbecause of course estimators have variances; that is, they vary from sample tosample, a fact represented by the standard error of the (Positive) autocorrelation has the effect of deflating the size of standarderrors.
6 This decrease in turn means that observed t values will be too large,leading one to reject null hypotheses that should perhaps be accepted, andthat confidence intervals will be too serious this problem is depends on what one is doing with the a large sample (T is large) and only one estimation equation thepotentially misleading results may be outweighed by the simplicityof ignoring the , however, social scientists and policy analysts build and testlots of models with the same data and so conduct numerous this situation, drawing firm conclusions might be difficult.
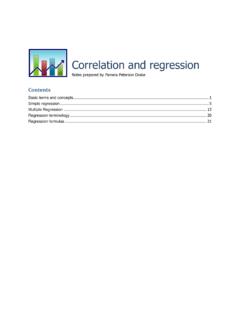
7 Especially in view of all the other problems inherent in 816 Class 20 REGRESSION of time SeriesPage 4 Year Imports 1949 1950 1951 1952 1953 1954 1955 1956 1957 1958 1959 1960 1961 1962 1963 1964 1965 1966 1967 1968 1969 1970 1971 1972 Year Imports 1973 1974 1975 1976 1977 1978 1979 1980 1981 1982 1983 1984 1985 1986 1987 1988 1989 1990 1991 1992 1993 1994 1995 1996 1.
8 Petroleum Product later we ll look at method for determining whether autocorrelationseems to be a problem and what to do it is. But for now back to somesimple intervention INTERVENTION MODEL: ENERGY IMPORTS AND s examine some data from the Department of Energy regarding petroleumproducts imports over the (nearly) last half particular we may want to know if the oil crises of the early 1970s hadany effect on are the data. The dependent variable is petroleum imports in millionsof barrels a can start by graphing the data as )For these it is convenient to use time SERIES plot, althoughthe data could be plotted as Y versus )Doing so, in fact, might help us interpret the )The next page contains a time SERIES 816 Class 20 REGRESSION of time SeriesPage 52)The plot shows an obvious point.
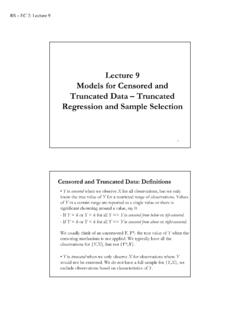
9 Petroleum imports leveledoff after about 1972 to )We ll use the year 1971, the beginning of the firstpostwar American energy )What impact did it have on imports? can compare the before and after levels using usual methods such asdifference of means procedures and tests or analysis of that analysis of variance allows one to compare and test fordifferences of two or more looked at the procedure when examining dummy are the results using 816 Class 20 REGRESSION of time SeriesPage 6 One-way Analysis of VarianceAnalysis of Variance for PetroimpSource DF SS MS F PPetdumy 1 46
10 47 Individual 95% CIs For Mean Based on Pooled StDevLevel N Mean StDev ---------+---------+---------+-------0 25 (-----*-----) 1 23 (-----*-----) ---------+---------+---------+-------Poo led Standard Dev = 2: ANOVA for Petroleum DataThe REGRESSION equation isPetroimp = + PetdumyPredictor Coef StDev T PConstant = R-Sq = R-Sq(adj) = of VarianceSource DF SS MS F PRegression 1 Error 46 47 3.