Transcription of 2.1 CalFresh Program Monthly Allotment and Income ...
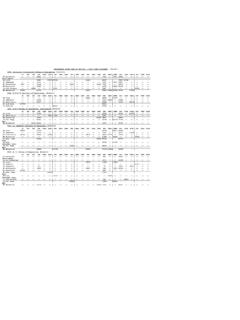
1 Medi-CalUpdate #21-08 Page 2-1 Charts2. CalFresh Charts2. CalFresh CalFresh Program Monthly Allotment and Income Eligibility Standards ChartThe chart below is effective 10/01/2021 to 09/30/2022 and provides the CalFresh (CF) maximum Monthly Allotment . This chart also provides Monthly Income limit amounts based on household SizeCalFresh Maximum Monthly AllotmentGross Monthly Income Eligibility Limits /IRT for SAR Households(130% FPL)aa. Equal to 130% of the Federal Poverty Level (FPL). Income of Households ineligible for MCE must be at or below the gross Monthly Income eligibility limit for the HH size. Net Monthly Income Eligibility Limits (100% FPL)bb. Equal to 100% FPL. If a household is eligible under the gross Monthly Income eligibility limit, then the HH's NET Monthly Income must be at or below the Monthly Income limit for the household Monthly Income Limits for Households Where Elderly/Disabled Are A Separate Household(165% FPL)cc.
2 Equal to 165% Monthly Income Eligibility Limit for Modified Categorical Eligibility (MCE) Households (200% FPL)dd. Equal to 200% FPL. Effective 07/1/2014, Non-Assistance CalFresh (NACF) HHs must meet the 200% FPL to be eligible for MCE. 1$250$1,396$1,074$1,771$2,1482$459$1,888 $1,452$2,396$2,9043$658$2,379$1,830$3,02 0$3,6604$835$2,871$2,209$3,644$4,4185$99 2$3,363$2,587$4,268$5,1746$1,190$3,855$2 ,965$4,893$5,9307$1,316$4,347$3,344$5,51 7$6,6888$1,504$4,839$3,722$6,141$7,4449$ 1,692$5,331$4,101$6,766$8,20210$1,880$5, 823$4,480$7,391$8,960 Each Additional HH Member+ $188+ $492+ $379+ $625+ $758 page 2-2 Charts2. CalFresh ChartsUpdate #21-08 Page DeductionsDEDUCTIONS AND ALLOWANCESAMOUNTEFFECTIVE DATESTANDARD DEDUCTIONS BY HOUSEHOLD SIZE$177 for households of 1 to 3 persons10/01/21 10/01/21 10/01/21 10/01/21$184 for households of 4 persons$215 for households of 5 persons$246 for households of 6 or more personsDEPENDENT CARENO Dependent Care Maximum limit10/01/08 MAXIMUM SHELTER DEDUCTION$59710/01/21 STANDARD UTILITY ALLOWANCE (SUA)$48710/01/21 LIMITED UTILITY ALLOWANCE (LUA)$14410/01/21 TELEPHONE UTILITY ALLOWANCE (TUA)$ 1910/01/21 HOMELESS STANDARD SHELTER DEDUCTION$ * ($160 in CalWIN)
3 10/01/21 EXCESS MEDICAL Under $35 a month-not eligible for deduction $ to $155 a month-eligible for $120 SMD $ a month and over-eligible to deduct actual medical expense in excess of $3510/01/17 EARNINGS20%05/01/86 and AllowancesMedi-CalUpdate #21-08 Page 2-3 Charts2. CalFresh CalFresh Maximum Resource LimitsThe chart below is effective 10/01/2021 to 09/30/2022. Household TypeMaximum Amount Households with at least one member who is age 60 or older and/or is disabled$3,750 All other households$2, Lottery or Gambling Winnings Limit Substantial lottery and gambling winnings are defined as being equal to or over the current elderly and/or disabled resource Benefit Issuance TableThe Benefit Issuance Tables display the benefit issuance amounts based on household size and Monthly net Income for each Federal Fiscal Year (FFY) from October 1 - September 30.
4 Current Benefit Issuance TableArchived Benefit Issuance TablesTemporary 15% Benefit Issuance Table (January 2021 to September 30, 2021)page 2-4 Charts2. CalFresh ChartsUpdate #21-08 Page Disaster CalFresh (D- CalFresh )D- CalFresh Income Eligibility Standards and Allotments Disaster Gross Income Limit (DGIL) and Maximum Allotment by household size for the period of October 1, 2021 through September 30, Gross Income Limit (DGIL) Computation TableThe following computation table shows how FNS computes the DGIL for a one-person household for FFY Monthly Net Income Limit for household size of one (100% of FPL)+$1,074 Maximum Standard Income Deduction+ $177 Maximum Shelter Expense Deduction + $597 Disaster Gross Income Limit = $1,848 October 1, 2021 through September 30, 2022 Household SizeDisaster Gross Income LimitMaximum Allotment1$1,848$2502$2,226$4593$2,604$6 584$2,990$8355 $3,399$9926$3,808$1,1907 $4,187$1,3168 $4,565$1,504 Each Additional Member+ $379+ $188 Revised.
5 10/21/2016 Update #20-06page 2-52. CalFresh Minimum Wage in Santa Clara CountyMinimum WageEffective DateNext increaseAmountNoteCity of Mountain View$ on CPIM inimum wage is adjusted annually based on the regional Consumer Price Index (CPI).City of Palo Alto$ on CPIM inimum wage is adjusted annually based on the regional Consumer Price Index (CPI).City of San Jose$ on CPIM inimum wage is adjusted annually based on the regional Consumer Price Index (CPI).City of Santa Clara$ on CPIM inimum wage is adjusted annually based on the regional Consumer Price Index (CPI).City of Saratoga$ on State Minimum wageWill increase annually based on the schedule for the new state minimum wage increase created by SB 3 (located on )City of Sunnyvale$ on CPIM inimum wage is adjusted annually based on the regional Consumer Price Index (CPI).
6 Revised: 10/21/2016 Update #20-06page 2-62. CalFresh Charts State of California Minimum Wage (effective January 1, 2021):Employers with 25 employees or less: $ per of Campbell$ on State Minimum wageWill increase annually based on the schedule for the new state minimum wage increase created by SB 3 (located on )City of Cupertino$ on CPIM inimum wage is adjusted annually based on the regional Consumer Price Index (CPI).City of Gilroy$ on State minimum wageWill increase annually based on the schedule for the new state minimum wage increase created by SB 3 (located on )City of Los Altos$ on CPIM inimum wage is adjusted annually based on the regional Consumer Price Index (CPI).City of Milpitas$ on CPIM inimum wage is adjusted annually based on the regional Consumer Price Index (CPI).City of Monte Sereno$ on State minimum wageWill increase annually based on the schedule for the new state minimum wage increase created by SB 3 (located on )City of Morgan Hill$ on State minimum wageWill increase annually based on the schedule for the new state minimum wage increase created by SB 3 (located on )Town of Los Altos Hills$ on State minimum wageWill increase annually based on the schedule for the new state minimum wage increase created by SB 3 (located on ).
7 Note: June City Agenda Town of Los Gatos$ on State minimum wageWill increase annually based on the schedule for the new state minimum wage increase created by SB 3 (located on )page 2-7 Charts2. CalFresh ChartsUpdate #21-08 Page 2-7 Employers with 26 employees or more: $ per hour.*This minimum wage chart should only be used to determine required Workfare hours for ABAWDs. page 2-8 Charts2. CalFresh ChartsUpdate #21-08 Page Supplemental Nutrition Program (SNB) ChartThe chart below is effective 10/1/2021 for the SNB Program based on household size. Medi-CalUpdate #21-08 Page 2-9 Charts2. CalFresh Transitional Nutrition Program (TNB) ChartThe chart below is effective 10/1/2021 for the TNB Program based on household size. Note: If on a continuing CalFresh household s effective date, the previously excluded SSI member, who holds the case number ( , is the primary payee), becomes the only household member ( , all the previously included members are reported to have left the household at the same time) and no additional members are added, it is possible to have an SNB Program household of one.
8 Page 2-10 Charts2. CalFresh ChartsUpdate #21-08 Page 2-10