Transcription of LTO International Milk Price Comparison 2012
1 1 LTO International milk Price Comparison 2012 2 LTO International milk Price Comparison 2012 COLOPHON Publisher LTO Nederland Vakgroep Melkveehouderij Box 29773, 2502 LT Den Haag The Netherlands June 2013 In co-operation with european Dairy Farmers c/o German Agricultural Society DLG Eschborner Landstrasse 122, D-60489 Frankfurt Germany Telephone (+ 49) 69 24 788 312 e-mail Cover design Willemijn de Lint, Haarlem Ordering The report can be downloaded at (in English and in Dutch).
2 Alternatively it can be ordered by: telephone: (+31) 79 3681506 e-mail: Copying the text is authorized subject to acknowledgement of source as follows: LTO- International milk Price Comparison , 3 LTO International milk Price Comparison 2012 Table of contents Foreword .. 4 1. Introduction and notes for readers .. 5 Introduction .. 5 Notes for readers .. 5 2. milk prices in 2012 .. 6 milk Price Comparison .. 6 Dairy market 2012 .. 8 Development of milk prices and markets in 2013 .. 8 Relationship european milk prices and world dairy product prices.
3 9 3. Additional information per company .. 10 Annex I. Key figures dairy companies .. 15 Annex II. milk prices 1999 to 2012 .. 22 Annex III. Average currency exchange rates 2012 and 2011 .. 23 4 LTO International milk Price Comparison 2012 Foreword Although 2012 was a year of relatively good milk prices most dairy farmers will look back on the past year with little pleasure. Owing to weather conditions ranging from poor to extreme in some countries yields of forage were quite disappointing with the result that costs were higher and milk production lower.
4 Thus 2012 was not a good year for farmers income. milk production made a poor start in 2013 owing to continued difficulties with the supply of feed and more disappointing weather. Fortunately the dairy market developed positively. After a steady start, milk prices began to rise considerably in the spring. It is expected that 2013 will be a year of good milk prices. For the Dutch Dairy Board, the outlook for the future is, regrettably, less positive. The Dutch government has decided to disband the commodity boards in the course of 2014. In consequence at this point in time we unfortunately cannot guarantee the continuation of this milk Price Comparison in coming years.
5 However, given their support, I am convinced that we will be able to find a solution in cooperation with european Dairy Farmers (EDF). After all, the goal of this milk Price Comparison , namely, transparency about milk prices paid to dairy farmers, is still as relevant today as it was at the start in 1999. Kees Romijn Chairman Dairy Committee Dutch Federation of Agriculture and Horticulture LTO Nederland 5 LTO International milk Price Comparison 2012 1. Introduction and notes for readers Introduction The LTO- International milk Price Comparison is published every month at the request of the Dairy Committee of the Dutch Federation of Agriculture and Horticulture (LTO Nederland) at This is a Comparison of prices paid for milk by large european companies and is done in co-operation with european Dairy Farmers (EDF).
6 EDF collects the milk Price data and makes them available. Calculations are undertaken by the Dutch Dairy Board (Productschap Zuivel, PZ). The method chosen for the calculations shows the Price a dairy farmer would receive if milk of specific (standard) composition, quality and quantity were delivered to the different dairy companies. In this report the following characteristics of the standard milk are taken as a basis: - fat; - protein; - total bacterial count 24,999 per ml; - somatic cell count 249,999 per ml; - annual delivery 500,000 kg.
7 The prices are exclusive of VAT, ex-farm and inclusive of supplementary payments. It must be emphasized that there is no Comparison of the average milk prices paid. The average Price paid by a dairy company for milk is dependent on the actual composition, quality, quantity et cetera of the milk delivered. Furthermore, no conclusions can be drawn about the performance of dairy companies on the basis of the milk prices paid. Many more factors play a role in assessing performance. After each calendar year has ended, a report is presented with the calculated milk prices paid for that year.
8 This annual report appears when the supplementary payments of the preceding calendar/ financial year are known and can, thus, be incorporated into the milk prices. The present publication comprises the milk prices calculated for the calendar year 2012 . Notes for readers Chapter 2 features the calculated milk prices for 2012 (paragraph ), followed by a description of the developments of the dairy market in 2012 ( ) and latest trends of milk prices and dairy markets in 2013 (paragraph ). In paragraph the development of european milk prices is compared with world market prices for dairy products.
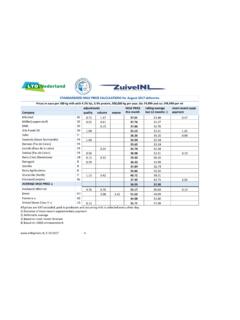
9 Chapter 3 gives additional information per dairy company. In the appendices certain basic data can be found about the dairy companies (Annex 1), milk prices per dairy company from 1999 to 2012 (Annex 2) and the average currency exchange rates in 2012 and 2011 (Annex 3). 6 LTO International milk Price Comparison 2012 2. milk prices in 2012 milk Price Comparison After the sharp increases in the past two years, the calculated milk prices of the 17 european dairy companies fell in 2012 by , to per 100 kg on average. Despite this decline, however, there is still talk of relatively good milk prices.
10 The average milk Price in 2012 was only surpassed in 2008 and the record year 2011. In fact for quite some time in 2012 it looked like milk prices would fall some more. After a good start milk prices began to decline firmly in the course of the year. After mid-year, however, milk prices began to bounce back. Lower milk production caused by adverse weather in combination with sustained demand ensured a recovery of the dairy market. Also, the marked increase in the milk prices of British dairy companies limited the decrease in the average of all milk prices.